

doi: 10.1529/biophysj.107.112201.
Epub 2007 Jul 27.
Fluorescence nanoscopy in whole cells by asynchronous localization of photoswitching emitters
Affiliations
- PMID: 17660318
- PMCID: PMC2025649
- DOI: 10.1529/biophysj.107.112201
Item in Clipboard
Fluorescence nanoscopy in whole cells by asynchronous localization of photoswitching emitters
Biophys J.
.
Abstract
We demonstrate nanoscale resolution in far-field fluorescence microscopy using reversible photoswitching and localization of individual fluorophores at comparatively fast recording speeds and from the interior of intact cells. These advancements have become possible by asynchronously recording the photon bursts of individual molecular switching cycles. We present images from the microtubular network of an intact mammalian cell with a resolution of 40 nm.
Figures

PALMIRA setup. The excitation beam is intensity controlled by an acousto-optical tunable filter (AOTF) and expanded by a telescope (T). Background is removed by a cleanup filter (CF) and the beam is converted from linear to circular polarization by a quarter wave plate (L4) and coupled into a regular commercial wide-field microscope. The fluorescent light is separated from the laser light by a dichroic filter (DF) and imaged onto an electron multiplying (EM) CCD camera. Stray laser light and background is removed by a notch (NF) and a bandpass filter (BP).

The combined CLEAN/mask-fitting algorithm used to identify and localize single emitters in individual camera frames. Each image is initially smoothed by a Gaussian filter that is much narrower than the PSF (full width at half-maximum of 70 nm); the resulting noise reduction is sufficient to provide notably better segmentation without compromising the localization precision. Subsequently, the pixel with the highest photon count is identified and used as a starting point for the mask-fitting iteration described in the text. If this iteration converges, the retrieved two-dimensional position of the marker is tabulated together with the number of photons constituting the event. A theoretical PSF is then subtracted from the image, scaled in such a way that the amplitude at the dye's position becomes zero above the median background. The algorithm then reiterates, identifying the pixel with the highest photon count. The escape point is reached when this photon count is below a certain threshold value, which is chosen well above background level to avoid artifacts.
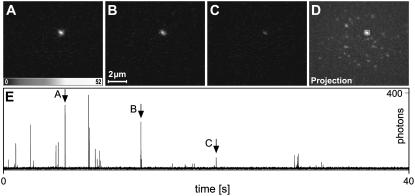
Imaging single rsFastLime molecules. Three typical recordings of a sparse rsFastLime sample (A–C) and the maximum projection from the whole series of 20,000 frames (D). The object marked in panel D is most likely a single molecule as the rsFastLime concentration was only 1.27 nM and our position retrieval algorithm did not show any indication that the object represents more than one molecule. In panel E, the time trace, integrated over the 4×4 pixels marked in panel D, is shown. The RSFP is switched on and off over 25 times. The arrows mark the bursts corresponding to the frames A–C. Because switching off as well as bleaching is a truly stochastic process, it is unknown whether the molecule was in its dark state or bleached after the recording.

Imaging E. coli. Conventional (A) and PALMIRA (B) image of a 200-nm-thick cryosection of cytoplasmic membrane labeled E. coli. The image was recorded in 140 s.
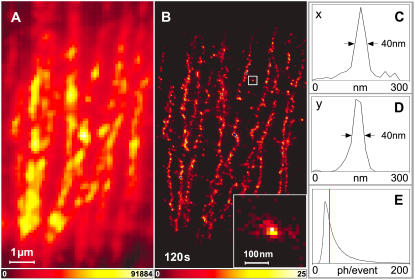
Imaging stained α-tubulin inside intact PtK2 cells. Conventional (A) and PALMIRA (B) image. The image was recorded in 120 s. The averaged line profiles in x (C) and y (D) direction of a single rsFastLime molecule or agglomeration of molecules (inset in B) prove a focal plane resolution of 40 nm. The distribution of detected photons per single molecule event is depicted in panel E. For large photon counts (>30), it is well approximated by a geometrical distribution with an expectation value of ∼21. Only events with 35 photons or more (red vertical line) were chosen for the data representation.
References
-
- Hell, S. W. 1994. Improvement of lateral resolution in far-field light microscopy using two-photon excitation with offset beams. Opt. Commun. 106:19–22.
-
- Hell, S. W., and J. Wichmann. 1994. Breaking the diffraction resolution limit by stimulated emission: stimulated emission depletion microscopy. Opt. Lett. 19:780–782. - PubMed
-
- Hell, S. 2003. Toward fluorescence nanoscopy. Nat. Biotechnol. 21:1347–1355. - PubMed
-
- Bobroff, N. 1986. Position measurement with a resolution and noise-limited instrument. Rev. Sci. Instrum. 57:1152–1157.
-
- Betzig, E. 1995. Proposed method for molecular optical imaging. Opt. Lett. 20:237–239. - PubMed
Publication types
MeSH terms
Substances
LinkOut - more resources
Full Text Sources
Other Literature Sources
