

Gibberellin regulation of fruit set and growth in tomato
- PMID: 17660355
- PMCID: PMC1976567
- DOI: 10.1104/pp.107.098335
Gibberellin regulation of fruit set and growth in tomato
Abstract
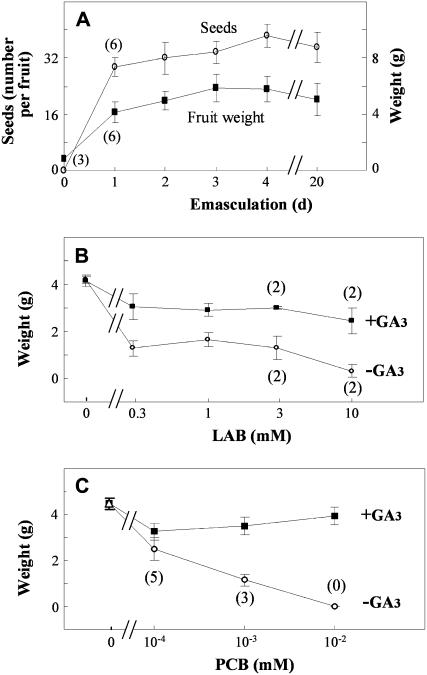
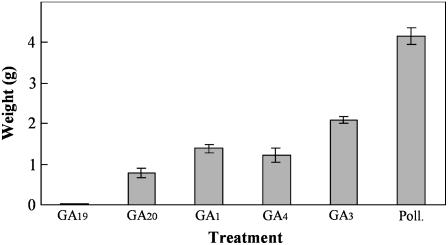
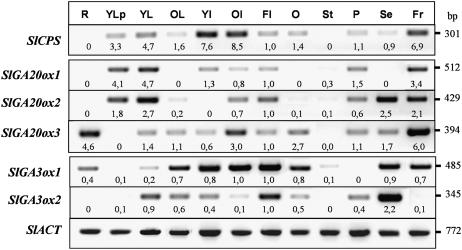
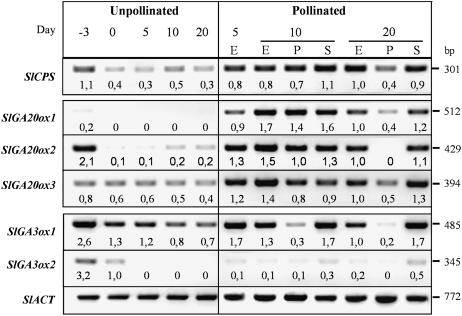
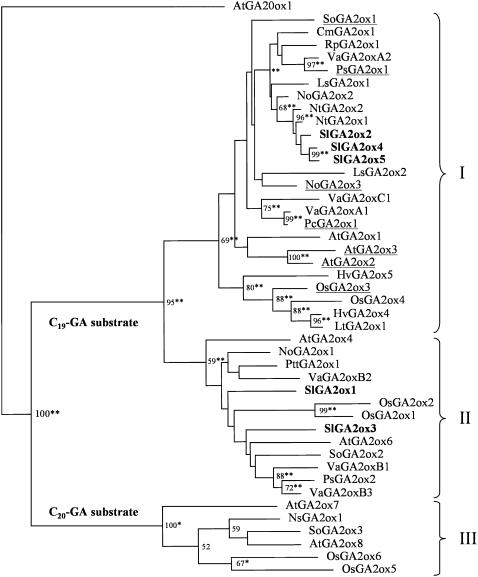
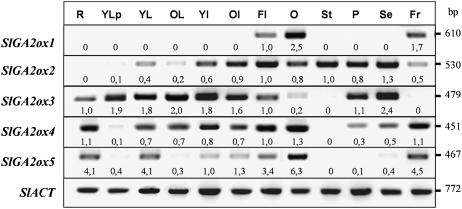
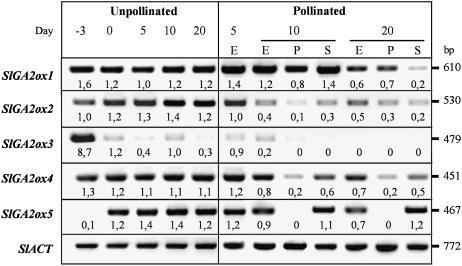
The role of gibberellins (GAs) in tomato (Solanum lycopersicum) fruit development was investigated. Two different inhibitors of GA biosynthesis (LAB 198999 and paclobutrazol) decreased fruit growth and fruit set, an effect reversed by GA(3) application. LAB 198999 reduced GA(1) and GA(8) content, but increased that of their precursors GA(53), GA(44), GA(19), and GA(20) in pollinated fruits. This supports the hypothesis that GA(1) is the active GA for tomato fruit growth. Unpollinated ovaries developed parthenocarpically in response to GA(3) > GA(1) = GA(4) > GA(20), but not to GA(19), suggesting that GA 20-oxidase activity was limiting in unpollinated ovaries. This was confirmed by analyzing the effect of pollination on transcript levels of SlCPS, SlGA20ox1, -2, and -3, and SlGA3ox1 and -2, encoding enzymes of GA biosynthesis. Pollination increased transcript content of SlGA20ox1, -2, and -3, and SlCPS, but not of SlGA3ox1 and -2. To investigate whether pollination also altered GA inactivation, full-length cDNA clones of genes encoding enzymes catalyzing GA 2-oxidases (SlGA2ox1, -2, -3, -4, and -5) were isolated and characterized. Transcript levels of these genes did not decrease early after pollination (5-d-old fruits), but transcript content reduction of all of them, mainly of SlGA2ox2, was found later (from 10 d after anthesis). We conclude that pollination mediates fruit set by activating GA biosynthesis mainly through up-regulation of GA20ox. Finally, the phylogenetic reconstruction of the GA2ox family clearly showed the existence of three gene subfamilies, and the phylogenetic position of SlGA2ox1, -2, -3, -4, and -5 was established.
Figures
Similar articles
-
Auxin-induced fruit-set in tomato is mediated in part by gibberellins.Plant J. 2008 Dec;56(6):922-34. doi: 10.1111/j.1365-313X.2008.03654.x. Epub 2008 Aug 12. Plant J. 2008. PMID: 18702668
-
Inhibition of auxin transport from the ovary or from the apical shoot induces parthenocarpic fruit-set in tomato mediated by gibberellins.Plant Physiol. 2010 Jun;153(2):851-62. doi: 10.1104/pp.110.155424. Epub 2010 Apr 13. Plant Physiol. 2010. PMID: 20388661 Free PMC article.
-
Tomato fruit set driven by pollination or by the parthenocarpic fruit allele are mediated by transcriptionally regulated gibberellin biosynthesis.Planta. 2007 Sep;226(4):877-88. doi: 10.1007/s00425-007-0533-z. Epub 2007 May 15. Planta. 2007. PMID: 17503074
-
The role of auxin and gibberellin in tomato fruit set.J Exp Bot. 2009;60(5):1523-32. doi: 10.1093/jxb/erp094. Epub 2009 Mar 25. J Exp Bot. 2009. PMID: 19321650 Review.
-
Parthenocarpic fruit development in tomato.Plant Biol (Stuttg). 2005 Mar;7(2):131-9. doi: 10.1055/s-2005-837494. Plant Biol (Stuttg). 2005. PMID: 15822008 Review.
Cited by
-
VlMYB4 and VlCDF3 co-targeted the VlLOG11 promoter to regulate fruit setting in grape (Vitis vinifera L).Plant Cell Rep. 2024 Jul 15;43(8):194. doi: 10.1007/s00299-024-03279-8. Plant Cell Rep. 2024. PMID: 39008131
-
Identification and genetic characterization of a gibberellin 2-oxidase gene that controls tree stature and reproductive growth in plum.J Exp Bot. 2012 Feb;63(3):1225-39. doi: 10.1093/jxb/err345. Epub 2011 Nov 11. J Exp Bot. 2012. PMID: 22080981 Free PMC article.
-
Decoding the molecular mechanism of parthenocarpy in Musa spp. through protein-protein interaction network.Sci Rep. 2021 Jul 16;11(1):14592. doi: 10.1038/s41598-021-93661-3. Sci Rep. 2021. PMID: 34272422 Free PMC article.
-
Characterization of Main Responsive Genes Reveals Their Regulatory Network Attended by Multi-Biological Metabolic Pathways in Paclobutrazol (PAC)-Modulated Grape Seed Development (GSD) at the Stone-Hardening Stage.Int J Mol Sci. 2025 Jan 27;26(3):1102. doi: 10.3390/ijms26031102. Int J Mol Sci. 2025. PMID: 39940872 Free PMC article.
-
Transcriptomic signatures in seeds of apple (Malus domestica L. Borkh) during fruitlet abscission.PLoS One. 2015 Mar 17;10(3):e0120503. doi: 10.1371/journal.pone.0120503. eCollection 2015. PLoS One. 2015. PMID: 25781174 Free PMC article.
References
-
- Ait-Ali T, Swain SM, Reid JB, Sun TP, Kamiya Y (1997) The LS locus of pea encodes the gibberellin biosynthesis enzyme ent-kaurene synthase A. Plant J 11 443–454 - PubMed
-
- Bensen RJ, Zeevaart JAD (1990) Comparison of ent-kaurene synthetase A and B activities in cell-free extracts from young tomato fruits of wild-type and gib-1, gib-2, and gib-3 tomato plants. J Plant Growth Regul 9 237–242
-
- Bohner J, Hedden P, Bora-Haber E, Bangerth F (1988) Identification and quantitation of gibberellins in frutis of Lycopersicon esculentum, and their relationship to fruit size in L. esculentum and L. pimpinellifolium. Physiol Plant 73 348–353
Publication types
MeSH terms
Substances
Associated data
- Actions
- Actions
- Actions
- Actions
- Actions
LinkOut - more resources
Full Text Sources
Miscellaneous
