Comparative Study
. 2007 Sep;177(1):631-53.
doi: 10.1534/genetics.107.078584. Epub 2007 Jul 29.

Toward a systems biology of mouse inner ear organogenesis: gene expression pathways, patterns and network analysis

Affiliations
Comparative Study

Toward a systems biology of mouse inner ear organogenesis: gene expression pathways, patterns and network analysis

Samin A Sajan et al. Genetics. 2007 Sep.

Abstract

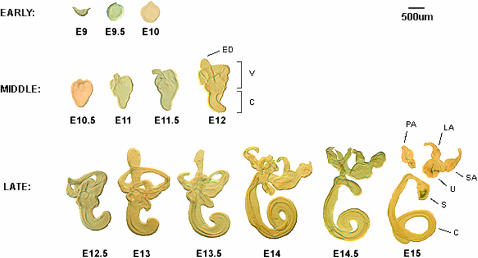
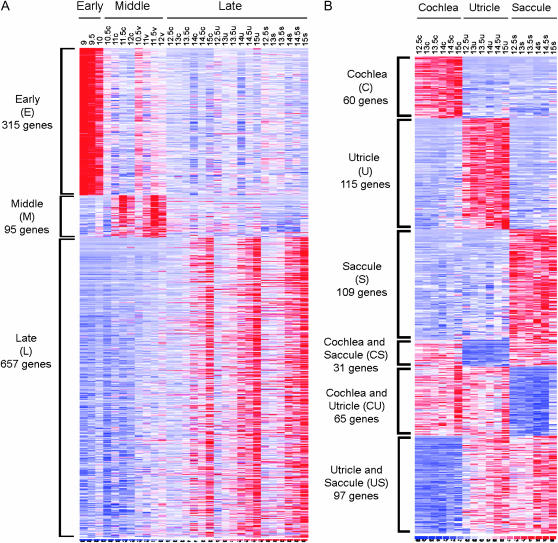
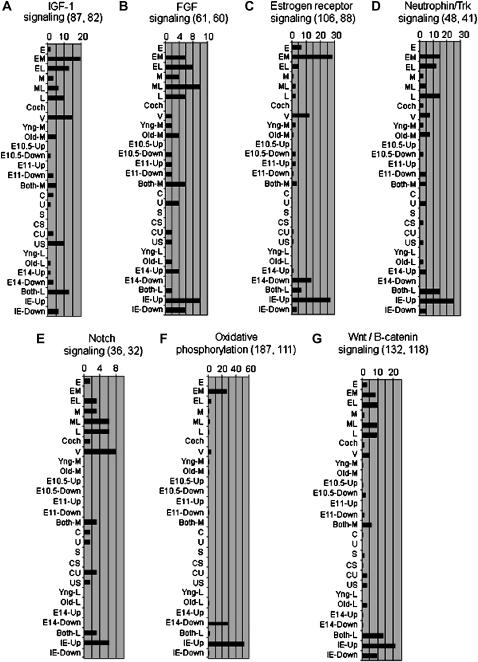
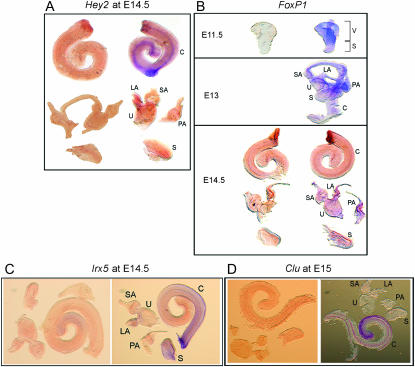
We describe the most comprehensive study to date on gene expression during mouse inner ear (IE) organogenesis. Samples were microdissected from mouse embryos at E9-E15 in half-day intervals, a period that spans all of IE organogenesis. These included separate dissections of all discernible IE substructures such as the cochlea, utricle, and saccule. All samples were analyzed on high density expression microarrays under strict statistical filters. Extensive confirmatory tests were performed, including RNA in situ hybridizations. More than 5000 genes significantly varied in expression according to developmental stage, tissue, or both and defined 28 distinct expression patterns. For example, upregulation of 315 genes provided a clear-cut "signature" of early events in IE specification. Additional, clear-cut, gene expression signatures marked specific structures such as the cochlea, utricle, or saccule throughout late IE development. Pathway analysis identified 53 signaling cascades enriched within the 28 patterns. Many novel pathways, not previously implicated in IE development, including beta-adrenergic, amyloid, estrogen receptor, circadian rhythm, and immune system pathways, were identified. Finally, we identified positional candidate genes in 54 uncloned nonsyndromic human deafness intervals. This detailed analysis provides many new insights into the spatial and temporal genetic specification of this complex organ system.


Figures

F<sc>igure</sc> 1.—
Figure 1.—
Representative microdissected IE tissues from mouse developmental stages E9 to E15 that were used for expression profiling. The top dorsal region is the vestibular organ, and the bottom ventral region is the cochlea. Early, middle, and late refer to the categories into which the structures were classified for data analysis (see Table 1). Early tissues were profiled whole, whereas the vestibular organ (V) and cochlea (C) from middle were profiled separately. In the late category, the cochlea and the saccule (S) were profiled individually. The utricle (U), posterior ampulla (PA), lateral ampulla (LA), and the superior ampulla (SA) were pooled and profiled together. The endolymphatic sac (ES) and the three semicircular canals were not profiled.
F<sc>igure</sc> 2.—
Figure 2.—
Self-organizing maps (SOM) depicting the patterns of genes whose expression showed a peak or a valley in only one sample relative to all others. The y-axis is the expression level of a sample as a fraction of the average expression in all 32 samples. Fractions less than zero were converted to negative reciprocals. The order of the data points on the x-axis from left to right is: E9, E9.5, E10, cochleae from E10.5 to E12, vestibular organs from E10.5 to E12, cochleae from E12.5 to E15, utricles from E12.5 to E15, saccules from E12.5 to E15, and NIE tissues from E9, E9.5–E10.5, and E11–E15. The centroid ID (beginning with c and ending with a colon) and the total number of genes with that particular centroid pattern are indicated above each square (centroid). The dark blue line traces the average expression of all genes within each centroid. The top and bottom red lines trace the expression pattern on the basis of maximal and minimal expression values for each data point, respectively. Note that the maximal and minimal values, from left to right, are not necessarily from the same probe set. (A) Genes downregulated in a NIE tissue sample relative to all IE tissue samples. (B) Genes downregulated in a NIE tissue sample as well as one IE tissue sample. (C) Genes upregulated in a NIE tissue sample relative to all IE tissue samples. (D) Genes upregulated in a NIE tissue sample as well as one IE tissue sample. (E) Genes upregulated in the cochlea at E15. These maps are shown in higher resolution in supplemental Figure 6.
F<sc>igure</sc> 3.—
Figure 3.—
Gene expression heat maps that illustrate temporal and tissue-specific signatures. In both A and B, each column is an individual IE sample (indicated on top), and each row represents a gene. Expression level increases from blue to white to red. The number of genes indicated in each expression pattern denotes those whose expression peaked by at least twofold in that pattern with an estimated false discovery rate (FDR) of <0.5%. Refer to supplemental Table 4 for a listing of the individual genes and fold changes within these expression patterns. (A) Heat maps of genes exhibiting three of the six expression patterns resulting from EML analysis (Table 2). Specifically, 315 genes were highly expressed in early stages, 95 in middle stages, and 657 in late stages. (B) Heat maps of genes with six expression patterns based on tissue type alone resulting from L analysis (Table 2). Shown are 60 genes whose expression peaked only in the cochlea, 115 only in the utricle, 109 only in the saccule, 31 in cochlea and saccule, 65 in cochlea and utricle, and 97 in utricle and saccule. c, cochlea; v, vestibular organ; u, utricle; s, saccule.
F<sc>igure</sc> 4.—
Figure 4.—
Examples of pathways deemed statistically significant by IPA within at least one expression pattern resulting from at least one analysis (see Table 2). To be deemed significant, the pathway is represented by at least two genes differentially expressed by ≥2-fold (for patterns of EML analysis) or ≥1.5-fold (for patterns of M and L analyses) with a Fisher's right-tailed exact test P-value of ≤0.05. The horizontal axis shows the percentage of genes within the pathway that varied in expression within a particular pattern of gene expression. For each pathway (A–G), the total number of genes (listed by Ingenuity) in the pathway and the number of pathway genes actually on the gene chip are shown in parentheses next to the pathway name. For example, in Notch signaling (E) a total of 36 genes are listed by Ingenuity, of which 32 were on the gene chip. The M pattern of gene expression shows differential expression of 2 notch pathway genes (6.25% of 32 genes). The E pattern exhibits differential expression of only 1 notch pathway gene (3.1% of 32 genes) and is thus not deemed significantly enriched for this pathway. Refer to supplemental Figure 5 for a similar depiction of all 53 pathways identified in this study.
F<sc>igure</sc> 5.—
Figure 5.—
Examples of networks generated by IPA using genes whose expression was upregulated in (A) L (late category), (B) C (late cochlea), and (C) S (late saccule). Each gene list was uploaded in Ingenuity to identify interactions among the genes within the list and also with other genes not in the list. Upregulated genes are shown in different shades of red (fold change increases from light to bright red), and those in green are genes that were not differentially expressed but were present in the appropriate category/subcategory (L, C, or S). Solid blue lines denote direct interactions and dashed blue lines denote indirect interactions (refer to key). Also indicated are genes that are parts of several biological signaling pathways with a known role in the IE.
F<sc>igure</sc> 6.—
Figure 6.—
Confirmatory whole mount RNA in situ hybridizations using antisense (right) and control sense (left) riboprobes for genes that show distinct patterns of gene expression from gene chip analysis. (A) Hey2 in the cochlea at E14.5 is localized in a stripe of cells that runs through the middle of the organ and corresponds to the region of the developing sensory epithelium. Its expression is not detectable in the components of the vestibular organ. See supplemental Figures 7 and 8 (http://www.genetics.org/supplemental/) for a higher resolution view. (B) FoxP1 at E11.5, E13, and E14.5. FoxP1 transcripts are significantly overexpressed in the vestibular region at E11.5 and at E13 this intensifies within the utricle and the three ampullae. This gene is also expressed within the semicircular canals, but at a reduced expression level. At E14.5 the message is still detected in the utricle and all three ampullae, although at a lower level compared to that at E13. However, expression of this gene is not detectable in the cochlea and in the saccule. Supplemental Figures 9–11 (http://www.genetics.org/supplemental/) provide a higher resolution view. (C) Irx5 at E15 appears to be localized in the cochlea, with a diffuse expression detected in the saccule as well. Within the cochlea it is expressed in a gradient that decreases from the base to the apex, with a more intense signal being detected in a stripe of cells along the very outer edge of this organ's curve. Note that the strong staining at the basal tip is nonspecific. See supplemental Figures 12 and 13 for a higher resolution view. (D) Clusterin at E15 is detected only in the cochlea and is expressed in two stripes that begin at the base of the cochlea and fuse at its apex. It appears to be expressed in a gradient opposite to that of Irx5 in that it is upregulated at the apex rather than at the base. For higher resolution images refer to supplemental Figures 14 and 15.

Similar articles

Cited by

References

    1. Anagnostopoulos, A. V., 2002. A compendium of mouse knockouts with inner ear defects. Trends Genet. 18: 499. - PubMed
    1. Anniko, M., 1983. Cytodifferentiation of cochlear hair cells. Am. J. Otolaryngol. 4: 375–388. - PubMed
    1. Avraham, K. B, 2003. Mouse models for deafness: lessons for the human inner ear and hearing loss. Ear Hear. 24: 332–341. - PubMed
    1. Beisel, K. W., T. Shiraki, K. A. Morris, C. Pompeia, B. Kachar et al., 2004. Identification of unique transcripts from a mouse full-length, subtracted inner ear cDNA library. Genomics 83: 1012–1023. - PubMed
    1. Bhave, S. A., E. C. Oesterle and M. D. Coltrera, 1998. Macrophage and microglia-like cells in the avian inner ear. J. Comp. Neurol. 398: 241–256. - PubMed

Publication types

Associated data