

Empirical Bayes inference of pairwise F(ST) and its distribution in the genome
- PMID: 17660541
- PMCID: PMC2034649
- DOI: 10.1534/genetics.107.077263
Empirical Bayes inference of pairwise F(ST) and its distribution in the genome
Abstract
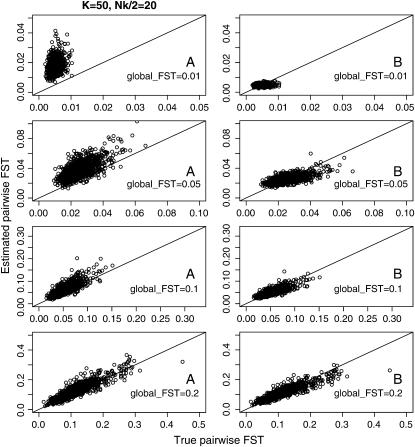
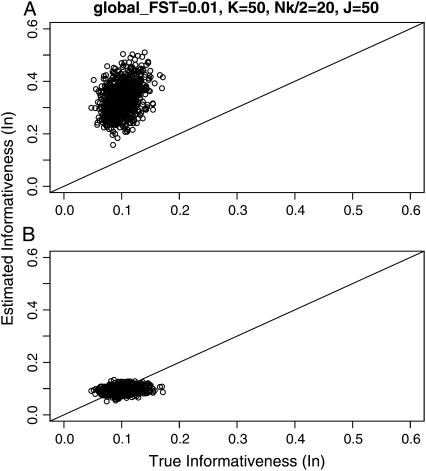
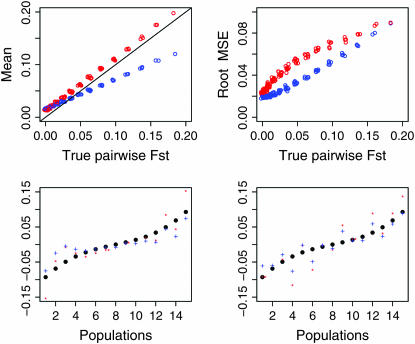
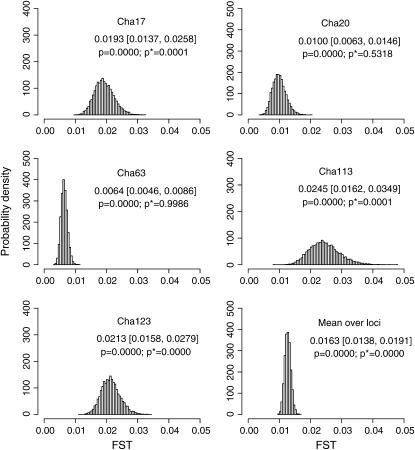
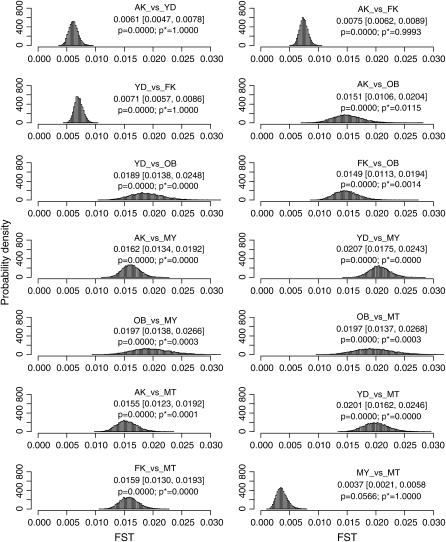
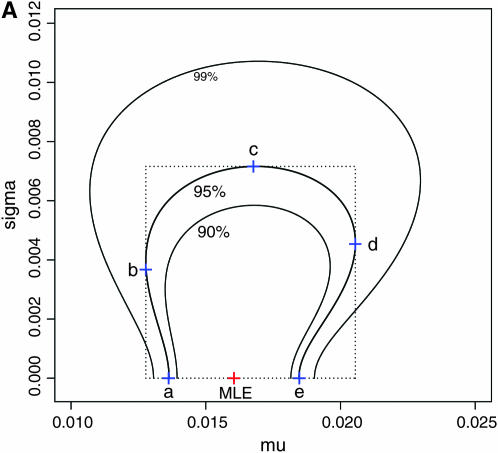
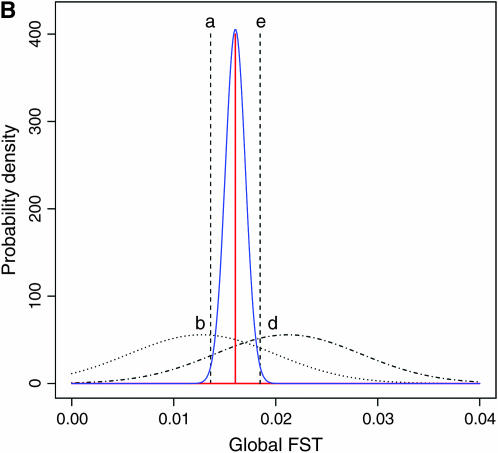
Populations often have very complex hierarchical structure. Therefore, it is crucial in genetic monitoring and conservation biology to have a reliable estimate of the pattern of population subdivision. F(ST)'s for pairs of sampled localities or subpopulations are crucial statistics for the exploratory analysis of population structures, such as cluster analysis and multidimensional scaling. However, the estimation of F(ST) is not precise enough to reliably estimate the population structure and the extent of heterogeneity. This article proposes an empirical Bayes procedure to estimate locus-specific pairwise F(ST)'s. The posterior mean of the pairwise F(ST) can be interpreted as a shrinkage estimator, which reduces the variance of conventional estimators largely at the expense of a small bias. The global F(ST) of a population generally varies among loci in the genome. Our maximum-likelihood estimates of global F(ST)'s can be used as sufficient statistics to estimate the distribution of F(ST) in the genome. We demonstrate the efficacy and robustness of our model by simulation and by an analysis of the microsatellite allele frequencies of the Pacific herring. The heterogeneity of the global F(ST) in the genome is discussed on the basis of the estimated distribution of the global F(ST) for the herring and examples of human single nucleotide polymorphisms (SNPs).
Figures
Similar articles
-
The empirical Bayes estimators of fine-scale population structure in high gene flow species.Mol Ecol Resour. 2017 Nov;17(6):1210-1222. doi: 10.1111/1755-0998.12663. Epub 2017 Apr 5. Mol Ecol Resour. 2017. PMID: 28241394
-
Comparative performance of single nucleotide polymorphism and microsatellite markers for population genetic analysis.J Hered. 2009 Sep-Oct;100(5):556-64. doi: 10.1093/jhered/esp028. Epub 2009 Jun 12. J Hered. 2009. PMID: 19525239
-
[Genome-Wide Analysis of Across Herd F(st) Heterogeneity in Holsteinized Livestock].Genetika. 2016 Feb;52(2):198-205. Genetika. 2016. PMID: 27215034 Russian.
-
Assessing population structure: F(ST) and related measures.Mol Ecol Resour. 2011 Jan;11(1):5-18. doi: 10.1111/j.1755-0998.2010.02927.x. Epub 2010 Oct 26. Mol Ecol Resour. 2011. PMID: 21429096 Review.
-
Genetics in geographically structured populations: defining, estimating and interpreting F(ST).Nat Rev Genet. 2009 Sep;10(9):639-50. doi: 10.1038/nrg2611. Nat Rev Genet. 2009. PMID: 19687804 Free PMC article. Review.
Cited by
-
Functional Haplotypes and Evolutionary Insight into the Granule-Bound Starch Synthase II (GBSSII) Gene in Korean Rice Accessions (KRICE_CORE).Foods. 2021 Oct 3;10(10):2359. doi: 10.3390/foods10102359. Foods. 2021. PMID: 34681408 Free PMC article.
-
Clinical validation of molecular markers of macrocyclic lactone resistance in Dirofilaria immitis.Int J Parasitol Drugs Drug Resist. 2018 Dec;8(3):596-606. doi: 10.1016/j.ijpddr.2018.06.006. Epub 2018 Jul 18. Int J Parasitol Drugs Drug Resist. 2018. PMID: 30031685 Free PMC article.
-
A Multilocus Approach to Understanding Historical and Contemporary Demography of the Keystone Floodplain Species Colossoma macropomum (Teleostei: Characiformes).Front Genet. 2018 Aug 14;9:263. doi: 10.3389/fgene.2018.00263. eCollection 2018. Front Genet. 2018. PMID: 30154822 Free PMC article.
-
Structural genomics: correlation blocks, population structure, and genome architecture.Curr Genomics. 2011 Mar;12(1):55-70. doi: 10.2174/138920211794520141. Curr Genomics. 2011. PMID: 21886455 Free PMC article.
-
Detection and analysis of complex structural variation in human genomes across populations and in brains of donors with psychiatric disorders.Cell. 2024 Nov 14;187(23):6687-6706.e25. doi: 10.1016/j.cell.2024.09.014. Epub 2024 Sep 30. Cell. 2024. PMID: 39353437
References
-
- Balding, D. J., 2003. Likelihood-based inference for genetic correlation coefficients. Theor. Popul. Biol. 63: 221–230. - PubMed
-
- Balding, D. J., and R. A. Nichols, 1997. Significant genetic correlations among Caucasians at forensic DNA loci. Heredity 78: 583–589. - PubMed
-
- Balloux, F., and N. Lugon-Moulin, 2002. The estimation of population differentiation with microsatellite markers. Mol. Ecol. 11: 155–165. - PubMed
-
- Cockerham, C. C., 1969. Variance of gene frequencies. Evolution 23: 72–83. - PubMed
Publication types
MeSH terms
LinkOut - more resources
Full Text Sources
Miscellaneous
