

Using quantitative trait loci results to discriminate among crosses on the basis of their progeny mean and variance
- PMID: 17660556
- PMCID: PMC2013701
- DOI: 10.1534/genetics.107.075358
Using quantitative trait loci results to discriminate among crosses on the basis of their progeny mean and variance
Abstract
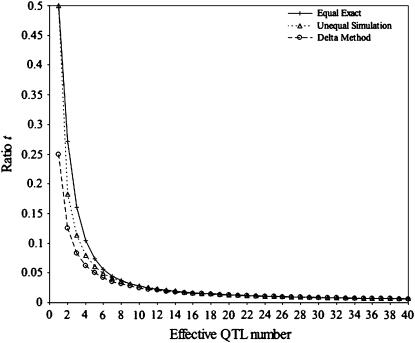
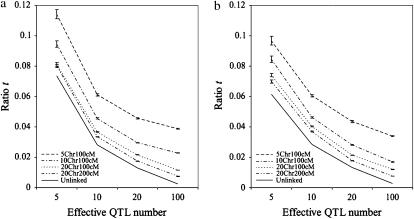
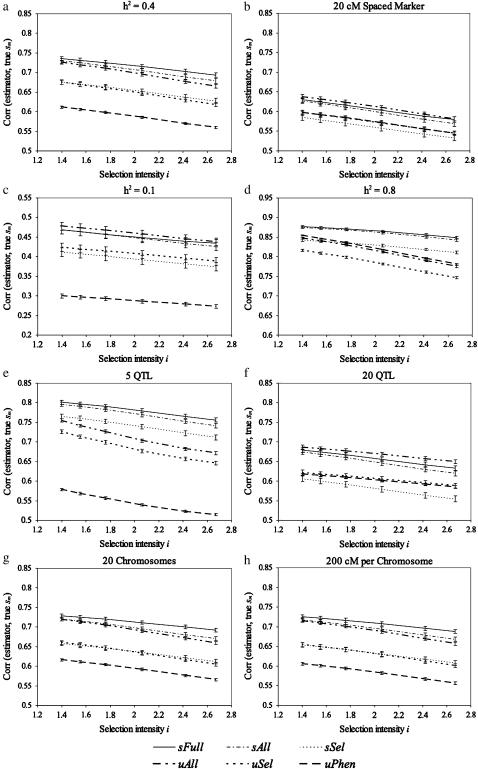
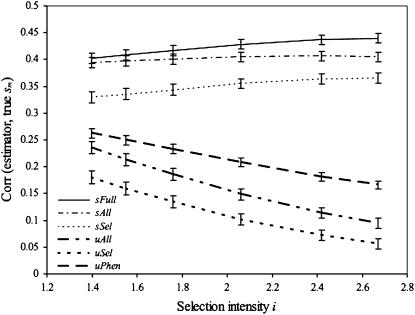
To develop inbred lines, parents are crossed to generate segregating populations from which superior inbred progeny are selected. The value of a particular cross thus depends on the expected performance of its best progeny, which we call the superior progeny value. Superior progeny value is a linear combination of the mean of the cross's progeny and their standard deviation. In this study we specify theory to predict a cross's progeny standard deviation from QTL results and explore analytically and by simulation the variance of that standard deviation under different genetic models. We then study the impact of different QTL analysis methods on the prediction accuracy of a cross's superior progeny value. We show that including all markers, rather than only markers with significant effects, improves the prediction. Methods that account for the uncertainty of the QTL analysis by integrating over the posterior distributions of effect estimates also produce better predictions than methods that retain only point estimates from the QTL analysis. The utility of including estimates of a cross's among-progeny standard deviation in the prediction increases with increasing heritability and marker density but decreasing genome size and QTL number. This utility is also higher if crosses are envisioned only among the best parents rather than among all parents. Nevertheless, we show that among crosses the variance of progeny means is generally much greater than the variance of progeny standard deviations, restricting the utility of estimates of progeny standard deviations to a relatively small parameter space.
Figures
References
-
- Beavis, W. D., 1994. The power and deceit of QTL experiments: lessons from comparative QTL studies, pp. 250–265 in Proceedings of the 49th Annual Corn and Sorghum Research Conference, edited by D. B. Wilkinson. American Seed Trade Association, Washington, DC.
-
- Bernardo, R., and J. Yu, 2007. Prospects for genome-wide selection for quantitative traits in maize. Crop Sci. 47: 1082–1090.
-
- Bernardo, R., L. Moreau and A. Charcosset, 2006. Number and fitness of selected individuals in marker-assisted and phenotypic recurrent selection. Crop Sci. 46: 1972–1980.
-
- Blanc, G., A. Charcosset, B. Mangin, A. Gallais and L. Moreau, 2006. Connected populations for detecting quantitative trait loci and testing for epistasis: an application in maize. Theor. Appl. Genet. 113: 206–224. - PubMed
-
- Bulmer, M. G., 1985. The Mathematical Theory of Quantitative Genetics. Clarendon Press, Oxford.
Publication types
MeSH terms
Substances
LinkOut - more resources
Full Text Sources
Other Literature Sources
Miscellaneous
