. 2007 Sep;177(1):239-53.
doi: 10.1534/genetics.107.072280. Epub 2007 Jul 29.

In vivo functional specificity and homeostasis of Drosophila 14-3-3 proteins

Affiliations

In vivo functional specificity and homeostasis of Drosophila 14-3-3 proteins

Summer F Acevedo et al. Genetics. 2007 Sep.

Abstract

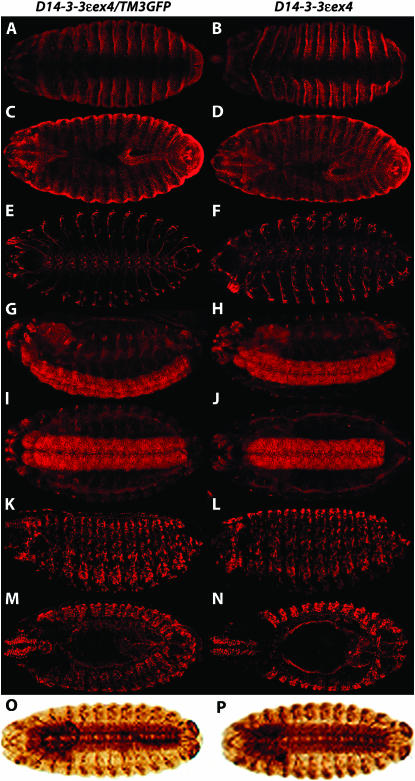
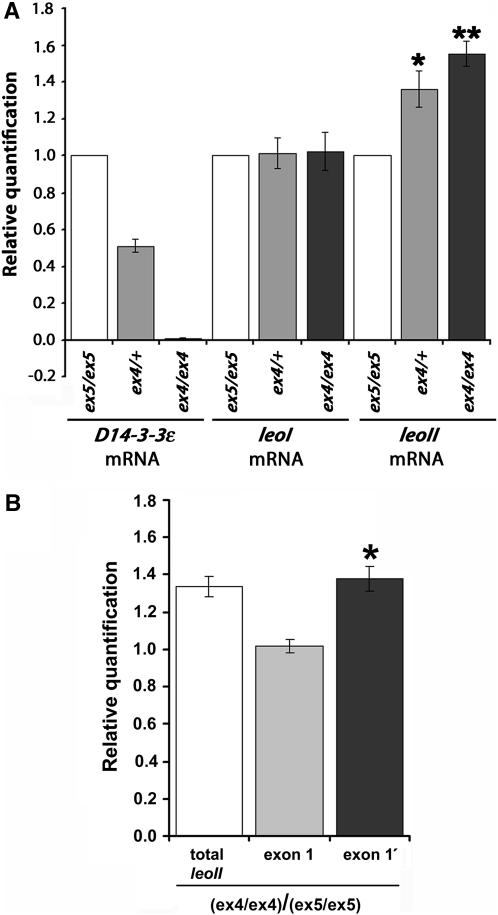
The functional specialization or redundancy of the ubiquitous 14-3-3 proteins constitutes a fundamental question in their biology and stems from their highly conserved structure and multiplicity of coexpressed isotypes. We address this question in vivo using mutations in the two Drosophila 14-3-3 genes, leonardo (14-3-3zeta) and D14-3-3epsilon. We demonstrate that D14-3-3epsilon is essential for embryonic hatching. Nevertheless, D14-3-3epsilon null homozygotes survive because they upregulate transcripts encoding the LEOII isoform at the time of hatching, compensating D14-3-3epsilon loss. This novel homeostatic response explains the reported functional redundancy of the Drosophila 14-3-3 isotypes and survival of D14-3-3epsilon mutants. The response appears unidirectional, as D14-3-3epsilon elevation upon LEO loss was not observed and elevation of leo transcripts was stage and tissue specific. In contrast, LEO levels are not changed in the wing disks, resulting in the aberrant wing veins characterizing D14-3-3epsilon mutants. Nevertheless, conditional overexpression of LEOI, but not of LEOII, in the wing disk can partially rescue the venation deficits. Thus, excess of a particular LEO isoform can functionally compensate for D14-3-3epsilon loss in a cellular-context-specific manner. These results demonstrate functional differences both among Drosophila 14-3-3 proteins and between the two LEO isoforms in vivo, which likely underlie differential dimer affinities toward 14-3-3 targets.


Figures

F<sc>igure</sc> 1.—
Figure 1.—
D14-3-3ε mutations and their effects on protein accumulation. (A) The genomic region and mutations of the D14-3-3ε gene. Exons are represented by solid boxes and introns and surrounding nontranscribed regions by lines. The P-element insertion in intron 1 is indicated by the arrow. The deleted DNA in D14-3-3εex4 and D14-3-3εex24 is indicated by the lines flanked by shaded boxes representing regions of uncertainty at the ends of the deficiencies. A perpendicular line indicates the precise excision of the j2B10 transposon in the revertant allele D14-3-3εex5. (B) Mutant homozygotes and heteroallelic combinations yield adult animals lacking D14-3-3ε protein demonstrated by semiquantitative Western blot analysis of whole-animal lysates of the indicated genotypes. The neuronal protein syntaxin (SYX) was used to control for the amount loaded per lane. ex5 stands for D14-3-3εex5, j2B10 for D14-3-3εl(3)j2B10, ex4 for D14-3-3εex4, and ex24 for D14-3-3εex24.
F<sc>igure</sc> 2.—
Figure 2.—
Morphology of D14-3-3ε homozygous mutant embryos. Embryos (16–18 hr old) are shown. Anterior is to the left. The genotype ascertained by concurrent staining with anti-GFP (see materials and methods) is shown on top of the two columns. A and B are ventral views, while C and D are dorsal views of embryos stained with anti-FASIII. There were no obvious gross morphological defects. E and F are ventral views of control and mutant embryos, respectively, stained with mAb22c10, and not showing overall deficits in CNS and PNS morphology. This was further demonstrated in homozygotes that failed to hatch (P), compared to heterozygotes 20 hr post-egg laying (O). The CNS and, to a lesser degree, the PNS were also examined with anti-neurotactin. I and J are lateral views, while K and L are ventral views and, in agreement with E and F, do not exhibit obvious structural differences of the CNS (and PNS) in mutant homozygotes compared to their heterozygous siblings. Similar results were obtained with homozygous embryos that failed to hatch (not shown). K and L are lateral views and M and N are dorsal views of embryos stained with anti-MEF-2, which failed to reveal significant changes in the musculature of the mutants.
F<sc>igure</sc> 3.—
Figure 3.—
Elevation of LEO in D14-3-3ε homozygous mutant embryos. (A) A representative blot of embryonic lysates used in acquisition of the data on B. The genotypes of the embryos whose lysates were blotted are indicated on top of the blot: ex5/ex5 for D14-3-3εex5/D14-3-3εex5; j2B10/+ for D14-3-3εl(3)j2B10/D14-3-3εex5; ex4/+ for D14-3-3εex4/D14-3-3εex5; j2B10/j2B10 for D14-3-3εl(3)j2B10/D14-3-3εl(3)j2B10; and ex4/ex4 for D14-3-3εex4/D14-3-3εex4. These abbreviations are used in A–D. β-Tub denotes β-tubulin, the protein used to normalize the lanes for the amount loaded. (B) The average ratios (± standard error of the mean or SEM) of the relative levels of LEO/β-Tub and D14-3-3ε/β-Tub is shown from four individual blots similar to the one displayed in A. Ratios are shown relative to those obtained from D14-3-3εex5 homozygotes, which were arbitrarily set to 1. The level of LEO accumulation was significantly higher (**P < 0.001) in D14-3-3εl(3)j2B10 and D14-3-3εex4 homozygotes compared to D14-3-3εex5 controls. (C) A representative blot of embryonic lysates of the indicated genotypes prepared at the particular times PEL. The latest collection was at 24 hr for D14-3-3εex4 homozygotes because of their hatching delay, while the latest time point for control embryos was immediately before hatching at 22 hr. (D) The average ratio of relative levels of LEO/β-Tub ± SEM for D14-3-3εex4 homozygotes compared to D14-3-3εex5 controls estimated from three independent blots similar to the one shown in C. There is a highly significant increase (**P < 0.001) in the amount of LEO in D14-3-3εex4 homozygotes during their 2-hr hatching delay. A smaller increase (*P < 0.05) in D14-3-3εex4 homozygotes was detected at 22-hr PEL in comparison to D14-3-3εex5 controls of the same age. Samples from D14-3-3εex4 homozygotes were not collected at 20-hr PEL and control samples could not be collected at 24-hr PEL because the embryos had hatched to larvae.
F<sc>igure</sc> 4.—
Figure 4.—
Elevation of leoII transcripts in D14-3-3εex4 mutant homozygotes. (A) The ratios of D14-3-3ε/act5C, leoI/act5C, and leoII/act5C RT–PCR products in control animals were arbitrarily set to 1 (open bars) and their relative levels in D14-3-3εex4 heterozygotes (shaded bars) and homozygotes (solid bars) were determined. The mean ± SEM of five independent experiments is shown. leoI levels relative to those of act5C were not found significantly different in mutant heterozygotes and homozygotes. In contrast, the relative levels of leoII mRNAs were significantly higher than controls in both mutant heterozygotes (*P < 0.01) and homozygotes (**P < 0.001). (B) The ratios of leoII transcripts in D14-3-3εex4 homozygotes over those of control animals [(ex4/ex4)/(ex5/ex5)] determined in experiments independent from those in A. Elevation of leoII in the mutants is detected because the ratio for “total leoII” is >1. Using primers specific to exon 1 and exon 1′, the levels of transcripts that include exon 1′ in the mutants were found significantly higher (*P < 0.01) than transcripts that include exon 1. The mean ± SEM of four independent experiments is shown.
F<sc>igure</sc> 5.—
Figure 5.—
D14-3-3ε is not elevated in leo homozygous mutant embryos. The average ratios (±SEM) of LEO/β-TUB and D14-3-3ε/β-TUB are shown from three individual experiments. Ratios are shown relative to those obtained from D14-3-3εex5/D14-3-3εex5 embryos, which were arbitrarily set to 1. The genotypes of the embryos whose lysates were blotted are ex5/ex5 for D14-3-3εex5/D14-3-3εex5; ex4/+ for D14-3-3εex4/D14-3-3εex5; ex4/ex4 for D14-3-3εex4/D14-3-3εex4, whereas full genotypes are shown for leo mutants. Compared to that in D14-3-3εex5 homozygotes, the level of LEO accumulation was significantly higher (**P < 0.001) in D14-3-3εex4 homozygotes and significantly reduced (**P < 0.001) in leo1188 homozygotes. The level of D14-3-3ε was also significantly reduced in late D14-3-3εex4 homozygous embryos.
F<sc>igure</sc> 6.—
Figure 6.—
LEO is not significantly elevated in the heads of adult D14-3-3ε homozygous mutants, and the level of D14-3-3ε is not changed in the heads of leo mutant heterozygotes. (A) The average ratios (±SEM) of LEO/SYX and D14-3-3ε/SYX is shown from three individual Western blotting experiments, one of which is shown in B. Ratios are shown relative to those obtained from D14-3-3εex5/D14-3-3εex5 adults, which were arbitrarily set to 1. Compared to the levels in D14-3-3εex5/D14-3-3εex5 controls, D14-3-3ε was significantly reduced (*P < 0.01) in D14-3-3εex4/D14-3-3εex5 (ex4/+), leoP1188/+; D14-3-3εex4/+ (leoP1188/+; ex4/+) double heterozygotes and D14-3-3εex4/D14-3-3εex4 (ex4/ex4) homozygotes (**P < 0.001). Similarly, LEO was significantly (*P < 0.01) reduced in leoP1188/+ and leoP1188/+; D14-3-3εex4/+ animals. However, LEO was not significantly elevated in the heads of D14-3-3εex4 homozygotes or D14-3-3ε in the heads of leoP1188 heterozygotes. (B). A representative blot of head lysates from the indicated genotypes quantified in A. The neuronal protein SYNTAXIN (Syx) was utilized to normalize the amount of each lysate loaded.
F<sc>igure</sc> 7.—
Figure 7.—
Deficits in cross-vein formation of D14-3-3ε mutants and transgenic rescue by D14-3-3ε and leo transgenes. (A) Posterior cross veins are indicated by arrows, while anterior cross veins are indicated by arrowheads in 1 and 6. Genotypes are 1, D14-3-3εex5/D14-3-3εex5; 2, D14-3-3εl(3)j2B10/D14-3-3εl(3)j2B10; 3, D14-3-3εex4/D14-3-3εex4; 4, D14-3-3εex4/D14-3-3εex5; 5, D14-3-3εl(3)j2B10/D14-3-3εex4 heteroallelic, exhibiting anterior cross-vein deficits also; 6, D14-3-3εex4/D14-3-3εex4, hsD14-3-3ε raised under HS conditions; 7, D14-3-3εl(3)j2B10/D14-3-3εl(3)j2B10, hsD14-3-3ε raised under HS conditions; 8, D14-3-3εex4/D14-3-3εex4, hsD14-3-3ε raised at 18°; 9, D14-3-3εex4/D14-3-3εex4, hsleoI raised under HS conditions; 10, D14-3-3εex4/D14-3-3εex4, hsleoII raised under HS conditions; 11, A D14-3-3εex4/D14-3-3εex4, hsleoII raised under HS conditions where both anterior and posterior cross veins remained defective. (B) Products of a RT–PCR experiment with RNA from larval wing disks and brains with primers specific for leoI and leoII transcripts (bottom) and amplification of act5C transcripts (top amplicon) as controls for the quality of the transcription. leoII is not expressed in larval wing disks. (C) Products of RT–PCR with transgene-specific primers (Philip et al. 2001), indicating that under HS conditions both leoI and leoII transgenes are expressed in dissected wing disks.

References

    1. Aitken, A., 1995. 14–3-3 proteins on the MAP. Trends Biochem. Sci. 20: 95–97. - PubMed
    1. Aitken, A., S. Howell, D. Jones, J. Madrazo and Y. Patel, 1995. 14–3-3 α and δ are the phosphorylated forms of Raf-activating 14–3-3 β and ζ. J. Biol. Chem. 270: 5706–5709. - PubMed
    1. Aitken, A., H. Baxter, T. Dubios, S. Clokie, S. Mackie et al., 2002. 14–3-3 proteins in cell regulation. Biochem. Soc. Trans. 30: 351–360. - PubMed
    1. Baxter, H. C., W.-G. Liu, J. L. Forster, A. Aitken and J. R. Fraser, 2002. Immunolocalisation of 14–3-3 isoforms in normal and scrapie-infected murine brain. Neuroscience 109: 5–14. - PubMed
    1. Benton, R., and D. St Johnston, 2003. Drosophila PAR-1 and 14–3-3 inhibit Bazooka/PAR-3 to establish complementary cortical domains in polarized cells. Cell 115: 691–704. - PubMed

Publication types

MeSH terms

LinkOut - more resources