

Bird and mammal sex-chromosome orthologs map to the same autosomal region in a salamander (ambystoma)
- PMID: 17660573
- PMCID: PMC2013703
- DOI: 10.1534/genetics.107.072033
Bird and mammal sex-chromosome orthologs map to the same autosomal region in a salamander (ambystoma)
Abstract
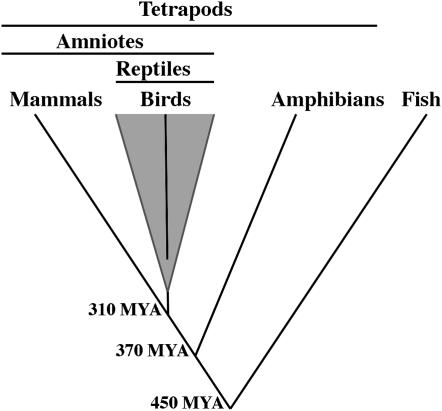
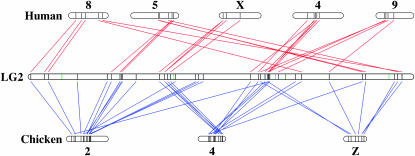
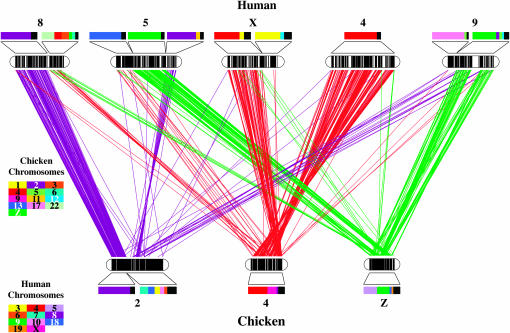
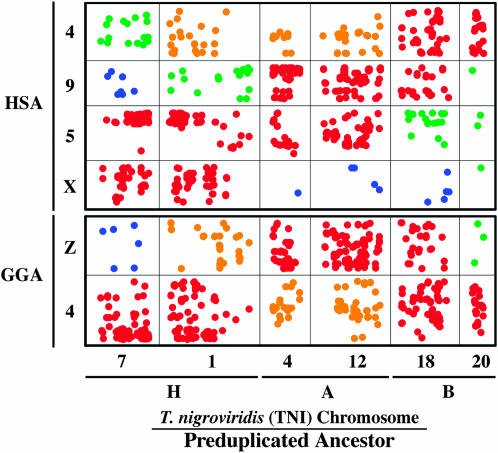
We tested hypotheses concerning the origin of bird and mammal sex chromosomes by mapping the location of amniote sex-chromosome loci in a salamander amphibian (Ambystoma). We found that ambystomatid orthologs of human X and chicken Z sex chromosomes map to neighboring regions of a common Ambystoma linkage group 2 (ALG2). We show statistically that the proportion of human X and chicken Z orthologs observed on ALG2 is significantly different from the proportion that would be expected by chance. We further show that conserved syntenies between ALG2 and amniote chromosomes are identified as overlapping conserved syntenies when all available chicken (N = 3120) and human (N = 14,922) RefSeq orthologs are reciprocally compared. In particular, the data suggest that chromosomal regions from chicken chromosomes (GGA) Z and 4 and from human chromosomes (HSA) 9, 4, X, 5, and 8 were linked ancestrally. A more distant outgroup comparison with the pufferfish Tetraodon nigroviridis reveals ALG2/GGAZ/HSAX syntenies among three pairs of ancestral chromosome duplicates. Overall, our results suggest that sex chromosomal regions of birds and mammals were recruited from a common ancestral chromosome, and thus our findings conflict with the currently accepted hypothesis of separate autosomal origins. We note that our results were obtained using the most immediate outgroup to the amniote clade (mammals, birds, and other reptiles) while the currently accepted hypothesis is primarily based upon conserved syntenies between in-group taxa (birds and mammals). Our study illustrates the importance of an amphibian outgroup perspective in identifying ancestral amniote gene orders and in reconstructing patterns of vertebrate sex-chromosome evolution.
Figures
Similar articles
-
Gene order data from a model amphibian (Ambystoma): new perspectives on vertebrate genome structure and evolution.BMC Genomics. 2006 Aug 29;7:219. doi: 10.1186/1471-2164-7-219. BMC Genomics. 2006. PMID: 16939647 Free PMC article.
-
Comparative mapping of Z-orthologous genes in vertebrates: implications for the evolution of avian sex chromosomes.Cytogenet Genome Res. 2002;99(1-4):178-84. doi: 10.1159/000071591. Cytogenet Genome Res. 2002. PMID: 12900562
-
Origin of amphibian and avian chromosomes by fission, fusion, and retention of ancestral chromosomes.Genome Res. 2011 Aug;21(8):1306-12. doi: 10.1101/gr.116491.110. Epub 2011 Apr 11. Genome Res. 2011. PMID: 21482624 Free PMC article.
-
Monotreme sex chromosomes--implications for the evolution of amniote sex chromosomes.Reprod Fertil Dev. 2009;21(8):943-51. doi: 10.1071/RD09250. Reprod Fertil Dev. 2009. PMID: 19874718 Review.
-
Avian sex, sex chromosomes, and dosage compensation in the age of genomics.Chromosome Res. 2014 Apr;22(1):45-57. doi: 10.1007/s10577-014-9409-9. Chromosome Res. 2014. PMID: 24599719 Review.
Cited by
-
Are homologies in vertebrate sex determination due to shared ancestry or to limited options?Genome Biol. 2010;11(4):205. doi: 10.1186/gb-2010-11-4-205. Epub 2010 Apr 30. Genome Biol. 2010. PMID: 20441602 Free PMC article. Review.
-
Convergent evolution of chicken Z and human X chromosomes by expansion and gene acquisition.Nature. 2010 Jul 29;466(7306):612-6. doi: 10.1038/nature09172. Epub 2010 Jul 11. Nature. 2010. PMID: 20622855 Free PMC article.
-
New resources inform study of genome size, content, and organization in nonavian reptiles.Integr Comp Biol. 2008 Oct;48(4):447-53. doi: 10.1093/icb/icn010. Epub 2008 Mar 16. Integr Comp Biol. 2008. PMID: 21669805 Free PMC article.
-
Comparative chromosome mapping of sex-linked genes and identification of sex chromosomal rearrangements in the Japanese wrinkled frog (Rana rugosa, Ranidae) with ZW and XY sex chromosome systems.Chromosome Res. 2008;16(4):637-47. doi: 10.1007/s10577-008-1217-7. Epub 2008 May 20. Chromosome Res. 2008. PMID: 18484182
-
Sex chromosome evolution among amniotes: is the origin of sex chromosomes non-random?Philos Trans R Soc Lond B Biol Sci. 2021 Sep 13;376(1833):20200108. doi: 10.1098/rstb.2020.0108. Epub 2021 Jul 26. Philos Trans R Soc Lond B Biol Sci. 2021. PMID: 34304592 Free PMC article.
References
-
- Amores, A., A. Force, Y. L. Yan, L. Joly, C. Amemiya et al., 1998. Zebrafish hox clusters and vertebrate genome evolution. Science 282: 1711–1714. - PubMed
-
- Ayling, L. J., and D. K. Griffin, 2002. The evolution of sex chromosomes. Cytogenet. Genome Res. 99: 125–140. - PubMed
-
- Bull, J. J., 1983. Evolution of Sex Determining Mechanisms. Benjamin Cummings, Menlo Park, CA.
-
- Burt, D. W., C. Bruley, I. C. Dunn, C. T. Jones, A. Ramage et al., 1999. The dynamics of chromosome evolution in birds and mammals. Nature 402: 411–413. - PubMed
Publication types
MeSH terms
Grants and funding
LinkOut - more resources
Full Text Sources
