. 2007 Sep;10(9):1176-84.
doi: 10.1038/nn1947. Epub 2007 Jul 29.

Adaptive regulation of sparseness by feedforward inhibition

Affiliations

Adaptive regulation of sparseness by feedforward inhibition

Collins Assisi et al. Nat Neurosci. 2007 Sep.

Abstract

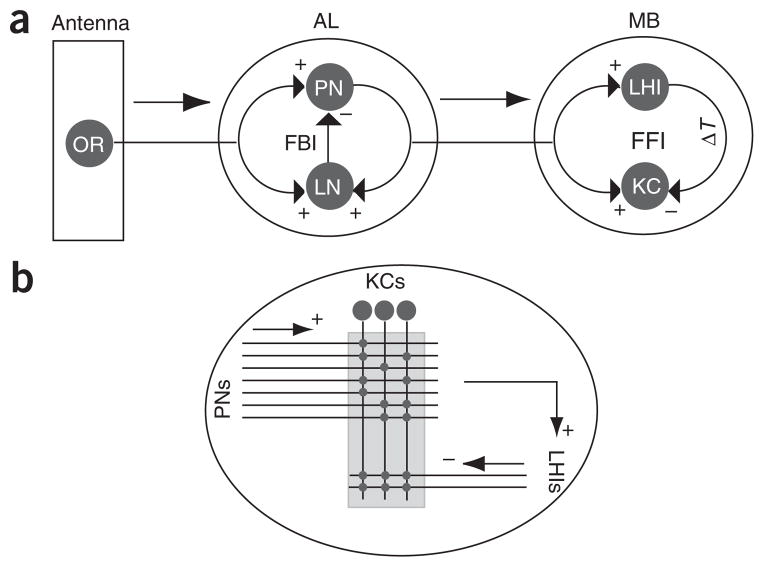
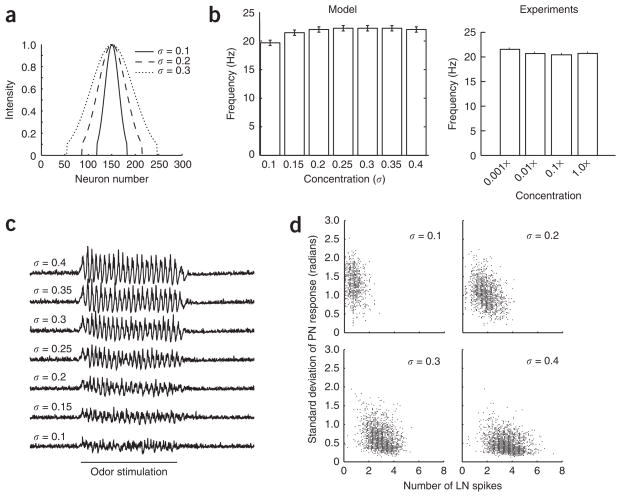
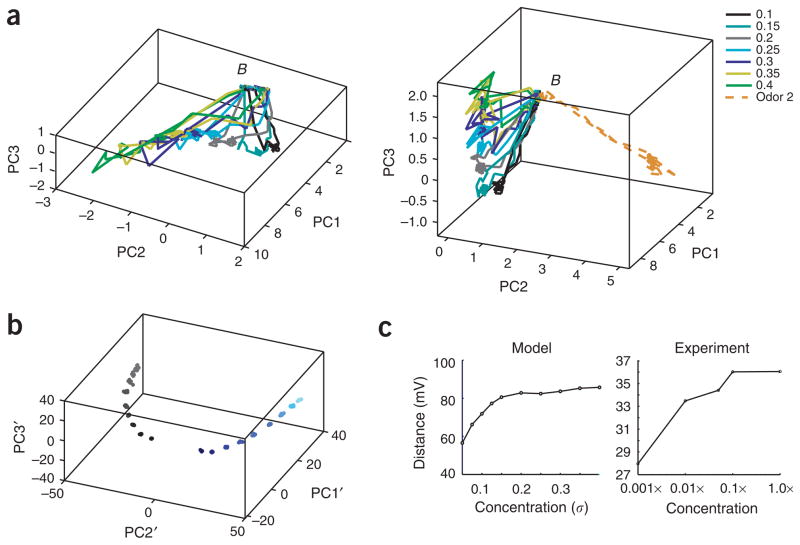
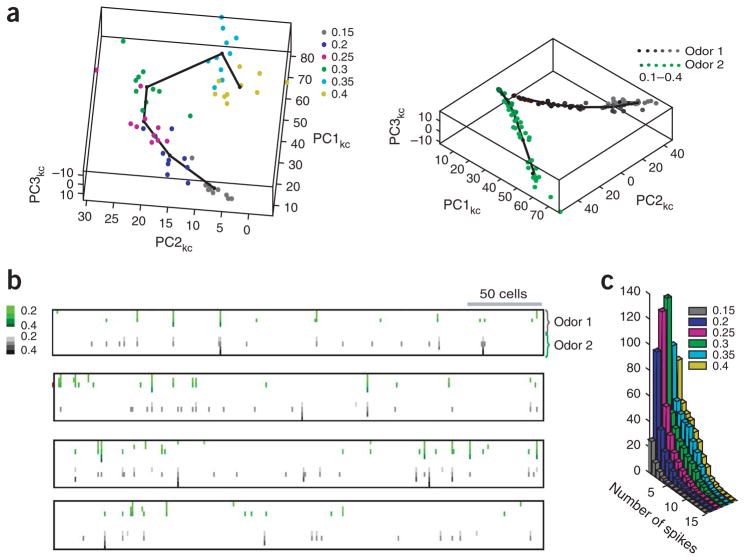
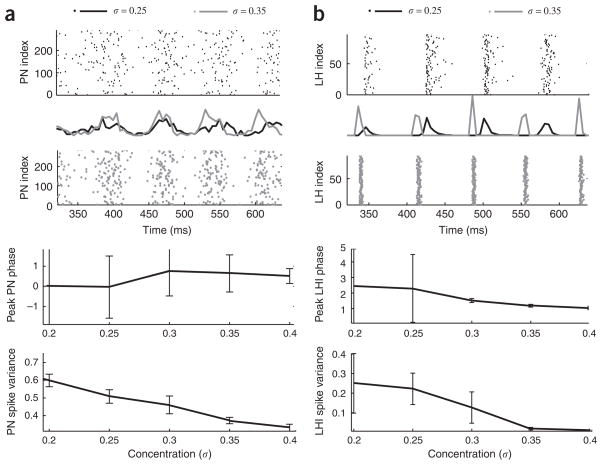
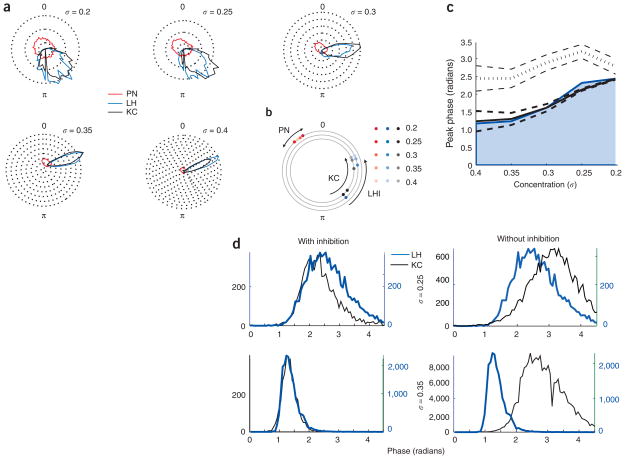
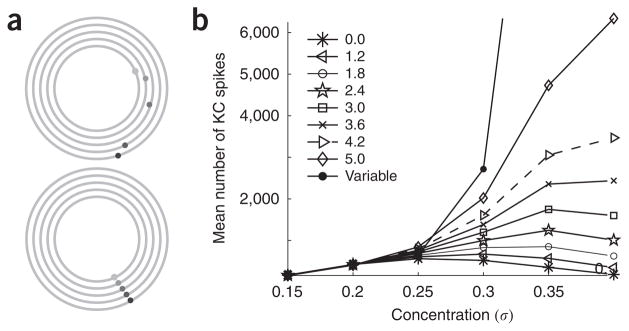
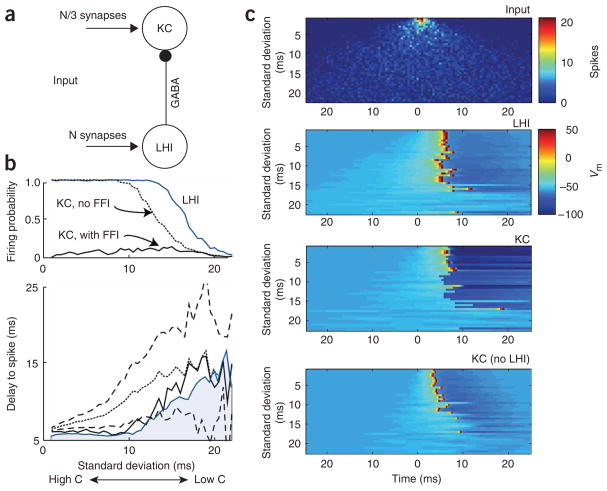
In the mushroom body of insects, odors are represented by very few spikes in a small number of neurons, a highly efficient strategy known as sparse coding. Physiological studies of these neurons have shown that sparseness is maintained across thousand-fold changes in odor concentration. Using a realistic computational model, we propose that sparseness in the olfactory system is regulated by adaptive feedforward inhibition. When odor concentration changes, feedforward inhibition modulates the duration of the temporal window over which the mushroom body neurons may integrate excitatory presynaptic input. This simple adaptive mechanism could maintain the sparseness of sensory representations across wide ranges of stimulus conditions.


Conflict of interest statement

COMPETING INTERESTS STATEMENT

The authors declare no competing financial interests.

Figures

Figure 1
Figure 1
Network structure. (a) The excitatory projection neurons (PN = 300) and inhibitory local interneurons (LNs = 100) receive input from olfactory receptor (OR) neurons. The PN-LN and LN-LN connection probability was set to 0.5. PNs receive feedback inhibition (FBI) from LNs. No connections were implemented between PNs. The LHIs (100) provide delayed (ΔT) feedforward inhibition (FFI) to the Kenyon cells (KCs = 15,000). (b) A detailed view of projections from PNs to the mushroom body (MB). The PNs project to the mushroom body along two pathways: a monosynaptic direct connection and a disynaptic pathway via the LHIs. The PN→LHI and the LHI→KC connections are all to all. Approximately 100 PNs synapse onto each KC.
Figure 2
Figure 2
Oscillatory dynamics of antennal lobe neurons for different odor concentrations. (a) For a particular odor, the input from the olfactory receptor neuron array is maximal to some projection neurons and progressively less to others. An increase in concentration is instantiated in the model by recruiting additional projection neurons. A quantitative measure of the concentration is the s.d., σ, of the input Gaussians. Three different concentrations used in the simulations are shown. Different odors may be simulated by shifting these curves along the abscissa, with the degree of overlap between Gaussians indicating the similarity between modeled odors. (b) LFP oscillation frequency for different concentrations. Left, mean frequency of the membrane potential of 300 projection neurons as a function of concentration ranging from σ = 0.1–0.4. Right, frequency of the LFP at four concentrations. An increase in concentration does not cause large variations in the frequency of the LFP, which remains around 20 Hz. (c) The membrane potential averaged across 300 projection neurons for different modeled concentrations. The amplitude of the oscillations increased with concentration. The horizontal line shows the time over which the stimulus was presented (duration = 1 s). (d) Mean number of spikes in all presynaptic local neurons versus the s.d. in the spike timing of their postsynaptic projection neurons across trials. The s.d. is computed in terms of the phase of the oscillatory LFP at which a projection neuron fires a spike. Increasing concentration led to an increase in the number of presynaptic local neuron spikes and a corresponding increase in the reliability of projection neuron spike phase across trials.
Figure 3
Figure 3
Collective dynamics of neurons in the modeled antennal lobe. (a) Visualization of the spatiotemporal dynamics of the 300 model projection neurons projected onto the first three principal components (mean over ten odor presentations, binned using 50-ms windows). Each trajectory covers 3 s, with the stimulus presented over 1 s. The trajectories originate from baseline (B). Different concentrations (σ) of the same odor (shown in different colors) evolved along neighboring trajectories (left), whereas different odors evolved along divergent trajectories (right). (b) Clustering of the spatiotemporal response patterns of the 300 model projection neurons for two odors across a range of six concentrations. Here, each trajectory shown in a is treated as a single point in a higher-dimensional space; each point corresponds to the response of the projection neuron ensemble to an odor presentation. The points clustered in an odor- (color) and concentration-dependent (shade) manner. The spatiotemporal response of the projection neuron ensemble diverged as a function of increasing concentration. The high-dimensional spatiotemporal patterns are projected onto the first three principal components for visualization. Dark color, low concentrations; light color, high concentrations. (c) The Euclidean distance between odor clusters as a function of odor concentration. Left, in the model, the distance increased for concentrations from 0.05 to ~0.25 and remained nearly constant for higher concentrations (σ = 0.25–0.4). Right, experimental data showing an increase in the distance between odor clusters (averaged for three odor pairs) from 10−3 to 10−1, followed by saturation between 10−1 and 1.
Figure 4
Figure 4
Collective dynamics of neurons in the modeled mushroom body. (a) Visualization of the model KC activity projected onto the first three principal components. Left, KC activity was computed by adding the number of spikes produced by each of 15,000 KCs over the stimulus duration to obtain a 15,000-dimensional vector. Each point corresponds to one trial of an odor presentation. The line joins the means of different concentration (different colors) clusters. Right, KC activity clustered along different concentration manifolds for dissimilar odors. (b) Diversity of KC responses to odor concentrations. Each plotted point represents an active KC (cells that spike in more than 50% of the trials). Individual KCs showed varying degrees of selectivity to different odor concentrations (dark color, low concentrations; light color, high concentrations; different colors correspond to different odors). Some cells spiked reliably for a wide range of concentrations, whereas others were responsive to specific odor-concentration pairs. Each panel consists of 300 randomly selected KCs. (c) Frequency distribution of KC response intensity (total number of spikes elicited by a 1-s odor presentation). Most cells responded with 1–3 spikes.
Figure 5
Figure 5
PN and LHI responses for different odor concentrations. (a,b) Top, the activity histogram and spike raster of PNs (a) and LHIs (b), shown for two concentrations. The timing of the peak activity of PNs did not show a clear dependence on concentration. The timing of peak LHI activity advanced for higher concentrations and LHI spiking became more coherent. The amplitude of LHI activity histograms (top) is rescaled. Bottom, the peak phase and the variance in the phase distribution for each concentration are shown for PNs (a) and LHIs (b). The peak PN phase did not advance systematically as a function of increasing concentration; variance of the PN phase, however, decreased consistently with increasing concentration. Solid lines show average network activity.
Figure 6
Figure 6
Effect of adaptive feedforward inhibition of KC activity. (a) Relationship between the phase of PN, LHI and KC spikes for different concentrations (σ = 0.2–0.4). Normalized phase histograms were computed using the phase of the PN, LHI and KC spikes with respect to the mean oscillatory membrane potential of the PNs during an odor presentation. The peak of the LFP oscillation corresponds to 0 radians; 0.09-radian bins. Normalization ensures that the area under the histogram is unity. Each concentric ring (dotted line) corresponds to a probability of 0.02. (b) Main peaks of the phase histograms in a. The phase difference between the excitatory PNs and the inhibitory LHIs decreased as a function of increasing concentration, ensuring that the KC spikes occurred in progressively smaller windows. (c) Average spike delay across all trials. The KC integration window, defined by the mean time delay (measured in terms of the phase of the PN LFP) of LHI spikes (shadowed area) decreased with decreasing s.d. Without inhibition, most KC spikes occurred outside this integration window. Discontinuous black lines show the mean time delay (dotted line) and the error bars (dashed lines) for KC spike timing in the absence of LHI inhibition. The solid black line shows the mean KC spike time delay in the presence of feedforward inhibition. (d) The phase distribution of LH and KC spikes for two concentrations (top, σ = 0.25; bottom, σ = 0.35). The peak phase of KC spikes in the absence of inhibition (right) occurred after the peak phase of LHI spikes. The magnitude of the peak KC phase increased dramatically with an increase in concentration. When LHI inhibition is present (left), most KC spikes that would have occurred after the peak of the LHI spike phase in the absence of inhibition were effectively cut off.
Figure 7
Figure 7
Phase advance of LHIs maintains the sparseness of KC activity. (a) Top, the LHIs, on average, spiked at earlier phases of the oscillatory cycle as a function of increasing concentration. The filled circles show the peak LHI phase as a function of increasing concentration. Bottom, the effect of the phase advance on the response of KCs was demonstrated by introducing an increasing delay, Δ(σ), that offsets the LHI activity such that the mean phase of LHI spikes did not change as a function of increasing concentration. This disambiguates the effect of the amplitude of LHI activity from its phase advance. (b) The phase advance of LHI spiking activity modulated the KC response. Two extreme cases, corresponding to a, top (labeled ‘0.0’), and a, bottom (labeled ‘variable’), show qualitatively different behavior for higher concentrations. The KC activity for intermediate fixed delays (Δ0 = 1.2–5 ms) ranged between these two extremes.
Figure 8
Figure 8
Role of feedforward inhibition in a minimal neural circuit. (a) KC is inhibited by LHI. Both KC and LHI received normally distributed random depolarizing input emulating spikes from the antennal lobe. N = 100 synapses were connected to LHI. Of these, N/3 randomly selected synapses were connected to KC. (b) Top, probability of firing. The LHI spiking probability (solid blue line) increased with increasing coherence (decreasing s.d.), whereas the KC spiking probability (solid black line) remained low when it received feedforward inhibition from LHIs. In the absence of LHI inhibition, KC spiking probability (dotted black line) increased monotonically as a function of decreasing s.d. until it spiked reliably during each odor presentation. Bottom, average spike delay across all trials. The KC integration window, defined by the mean time delay of LHI spikes (light blue area), decreased with decreasing s.d. Without inhibition, most KC spikes occurred outside this integration window. Discontinuous black lines show the mean time delay (dotted line) and the error bars (dashed lines) for KC spike timing in the absence of LHI inhibition. The solid black line shows the mean KC spike time delay in the presence of feedforward inhibition. (c) External input and responses of KC and LHI for one representative trial of external stimulation. Top, arrival times (abcissa) of external spikes were plotted for different values of s.d. (ordinate). The color bar indicates number of input spikes in 0.5-ms bins. Middle, responses of LHI and KC in the presence of feedforward inhibition. Bottom, KC response in absence of LHI-mediated inhibition. The color bar indicates membrane voltage Vm.

Similar articles

Cited by

References

    1. Gross-Isseroff R, Lancet D. Concentration-dependent changes of perceived odor quality. Chem Senses. 1988;13:191–204.
    1. Bhagavan S, Smith BH. Olfactory conditioning in the honey bee, Apis mellifera: effects of odor intensity. Physiol Behav. 1997;61:107–117. - PubMed
    1. Stopfer M, Jayaraman V, Laurent G. Intensity versus identity coding in an olfactory system. Neuron. 2003;39:991–1004. - PubMed
    1. Laurent G. Olfactory network dynamics and the coding of multidimensional signals. Nat Rev Neurosci. 2002;3:884–895. - PubMed
    1. Kanerva P. Sparse Distributed Memory. Bradford Books; Boston: 1988.

Publication types