Review
. 2007 Sep-Oct;13(9-10):527-41.
doi: 10.2119/2006-00107.Trevino.

DNA microarrays: a powerful genomic tool for biomedical and clinical research

Affiliations
Review

DNA microarrays: a powerful genomic tool for biomedical and clinical research

Victor Trevino et al. Mol Med. 2007 Sep-Oct.

Abstract

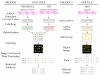
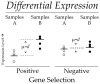
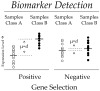
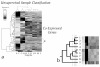
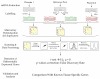
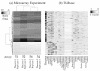
Among the many benefits of the Human Genome Project are new and powerful tools such as the genome-wide hybridization devices referred to as microarrays. Initially designed to measure gene transcriptional levels, microarray technologies are now used for comparing other genome features among individuals and their tissues and cells. Results provide valuable information on disease subcategories, disease prognosis, and treatment outcome. Likewise, they reveal differences in genetic makeup, regulatory mechanisms, and subtle variations and move us closer to the era of personalized medicine. To understand this powerful tool, its versatility, and how dramatically it is changing the molecular approach to biomedical and clinical research, this review describes the technology, its applications, a didactic step-by-step review of a typical microarray protocol, and a real experiment. Finally, it calls the attention of the medical community to the importance of integrating multidisciplinary teams to take advantage of this technology and its expanding applications that, in a slide, reveals our genetic inheritance and destiny.


Figures

Figure 1
Figure 1. Schematic representation of a gene expression microarray assay.
Arrows represent process (left column) and pictures or text represent the product. Differences in the protocol in one- and two-dye technologies are specific to the technology rather than samples or question. For CGH the process is similar replacing mRNA by gDNA.
Figure 2
Figure 2. Detection of Differential Expressed Genes.
Large differences in gene expression are likely to be genuine differences between two groups of samples (A and B) whereas small differences are unlikely to be truly differences. Samples can be biological replicates or unreplicated populational samples.
Figure 3
Figure 3. Biomaker Detection.
Larger differences in gene expression are more likely to be genuine differences between two groups of samples (A and B) than small differences. In this case, a large number of samples are more informative than individual replications.
Figure 4
Figure 4. Unsupervised classification and detection of co-expressed genes.
(A) Double-Hierarchical clustering of gene expression values (heatmap), in rows by genes, and in columns by samples. Similar samples (columns) generate clusters easily identified. For example, the gene expression of samples A and C is similar across genes. However A and C are different from the rest. Co-expressed genes (rows) form tight and small clusters. A selected cluster framed by dotted lines is shown in B. (B) Hierarchical generation of clusters from a selected group of genes in A.
Figure 5
Figure 5. Selection procedure for genes associated to survival times as risk factors.
A positive gene (left plot) is that whose expression included as a risk factor in a survival model (cox, exponential, poison, etc.) can be fitted reasonably well (dotted line) to the original survival times (steep solid line). The predicted survival curve from a negative gene (dotted line in right plot) is not close to the observed survival curve (steep solid line).
Figure 6
Figure 6. Selection procedure for genes associated to outcome.
The expression of a positive gene (horizontal axis in left plot) is highly correlated with the associated outcome (vertical axis). For a non-associated gene (right plot), the gene expression (horizontal axis) is not correlated to outcome (vertical axis).
Figure 7
Figure 7. Detection of altered methylated patterns and DNA polymorphisms in genomic DNA.
Left Panel: Enrichment of unmethylated DNA fragments (see text). Right Panel: Enrichment of hypermethylated fragments (see text). Scheme adapted from Schumacher et al. (2006).
Figure 8
Figure 8. Major techniques for detection of SNPs using microarrays.
Colors and patterns are used for illustrative purposes. Scheme adapted from Syvanen (2005).
Figure 9
Figure 9. Chromatin immune-precipitation (ChIP-on-chip) assay.
The generation of a hybrid gene between a gene for a transcription factor (TF) and a tag coding sequence renders a quimaeric TF. Upon binding to its DNA target the complex can be pulled-down from the tag to recover such type of DNA sequences.
Figure 10
Figure 10. Multi-pathogen detection using DNA microarrays.
Specific DNA sequences from disease-causing micro-organisms can be spotted on a microarray for pathoghen detection.
Figure 11
Figure 11. Experimental design of the placenta microarray experiment.
RNAs from two term human placentas were compared to RNAs from a collection of human tissues, except placenta, in search of placental specific transcripts.
Figure 12
Figure 12. Quality Assesment and Normalization
(a) Ratio values (M=Log2(R/G), R=Red channel, G=Green channel) versus average values (A=Log2(R*G)/2) for one placenta sample. Dots represent spots in the microarray. Crosses correspond to control spots. Lines represent the tendency for each block (print-tip) in the microarray. (b) Control assay, two reference mRNA aliquots were hybridized changing the dye color only. Symbols like in (a), (c) Normalized data from (a), (d) Normalized data from (b). Control spots removed in (c) and (d).
Figure 13
Figure 13. Genes differentially expressed in placenta compared to other tissues
(a) Heatmap showing the relative gene expression in placenta. Darker color means higher expression in placenta. Genes are ordered using a hierarchical clustering algorithm, (b) Heatmap showing the score in T1dbase corresponding to genes in (a). Darker colors represents more specific expression.

Similar articles

Cited by

References

    1. Golub TR, Slonim DK, Tamayo P, et al. Molecular classification of cancer: Class discovery and class prediction by gene expression monitoring. Science. 1999;286:531–537. - PubMed
    1. van’t Veer LJ, Dai HY, van de Vijver MJ, et al. Gene expression profiling predicts clinical outcome of breast cancer. Nature. 2002;415:530–536. - PubMed
    1. Singh D, Febbo PG, Ross K, et al. Gene expression correlates of clinical prostate cancer behavior. Cancer Cell. 2002;1:203–209. - PubMed
    1. Wang T, Hopkins D, Schmidt C, et al. Identification of genes differentially over-expressed in lung squamous cell carcinoma using combination of cDNA subtraction and microarray analysis. Oncogene. 2000;19:1519–1528. - PubMed
    1. Alon U, Barkai N, Notterman DA, et al. Broad patterns of gene expression revealed by clustering analysis of tumor and normal colon tissues probed by oligonucleotide arrays. Proceedings of the National Academy of Sciences of the United States of America. 1999;96:6745–6750. - PMC - PubMed

Publication types

LinkOut - more resources