. 2008 Feb;25(2):453-62.
doi: 10.1007/s11095-007-9407-0. Epub 2007 Jul 28.

Impaired clearance of methotrexate in organic anion transporter 3 (Slc22a8) knockout mice: a gender specific impact of reduced folates

Affiliations

Impaired clearance of methotrexate in organic anion transporter 3 (Slc22a8) knockout mice: a gender specific impact of reduced folates

Adam L VanWert et al. Pharm Res. 2008 Feb.

Abstract

Purpose: To elucidate the role of the renal basolateral transporter, Oat3, in the disposition of methotrexate.

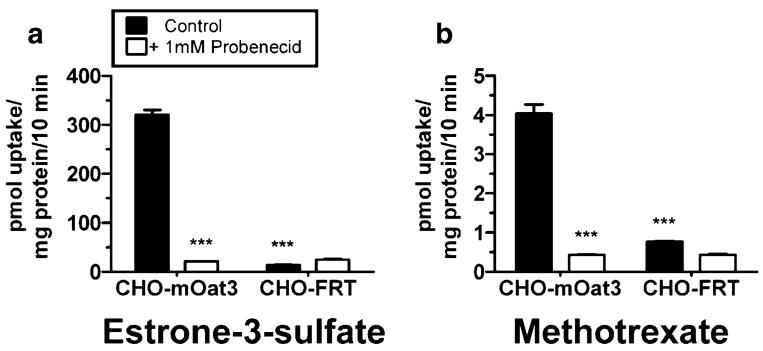
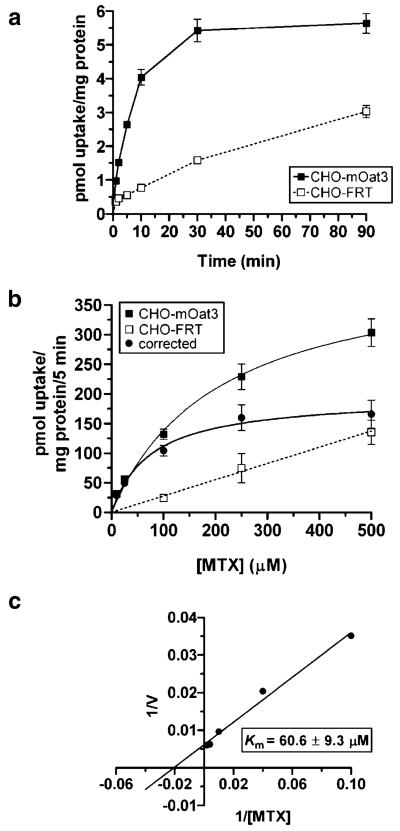
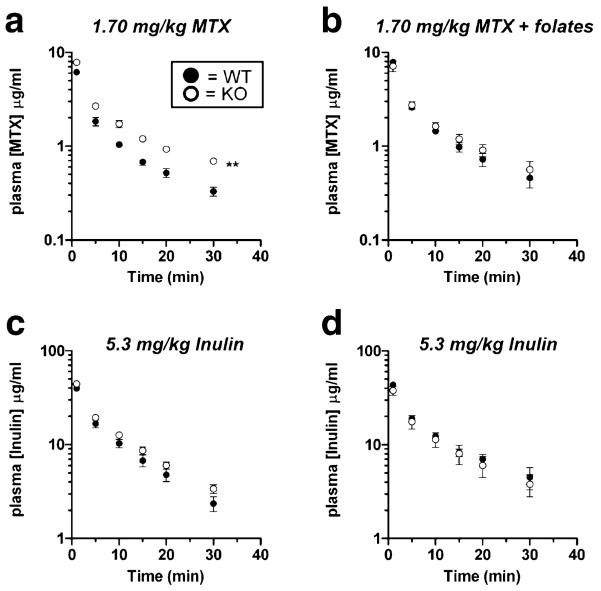
Materials and methods: Chinese hamster ovary cells expressing mouse Oat3 were used to determine kinetics and specificity of inhibition of methotrexate transport. Methotrexate clearance was then examined in vivo in wildtype and Oat3 knockout mice.

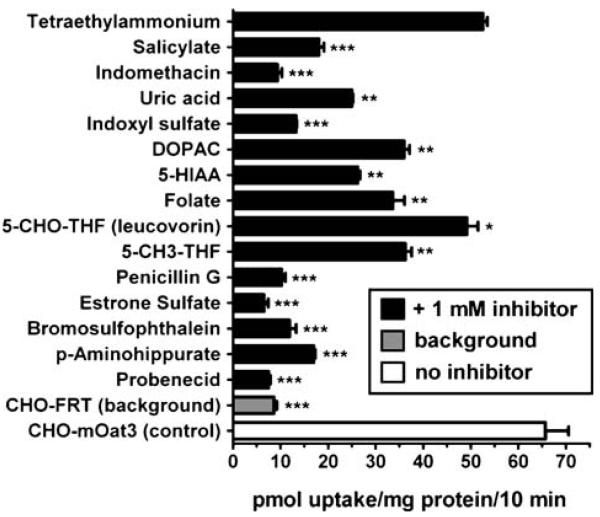
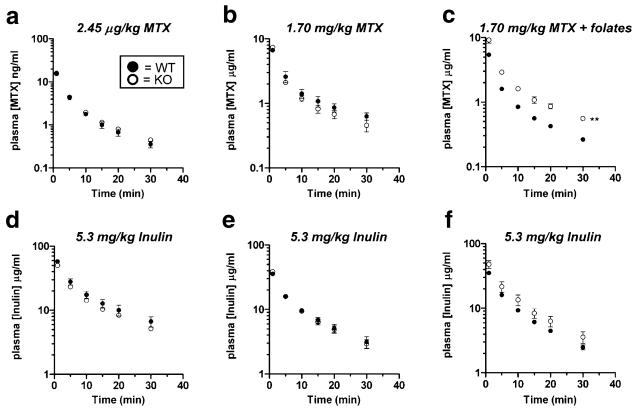
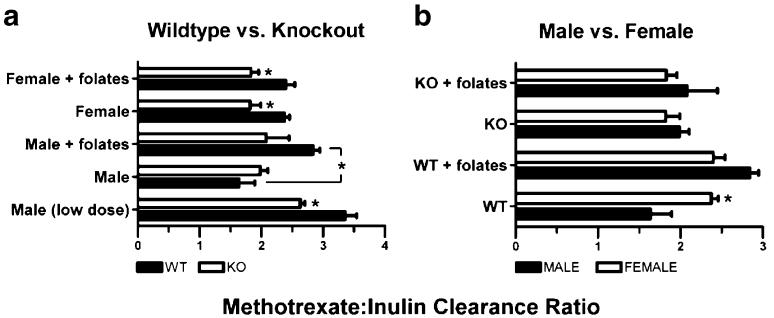
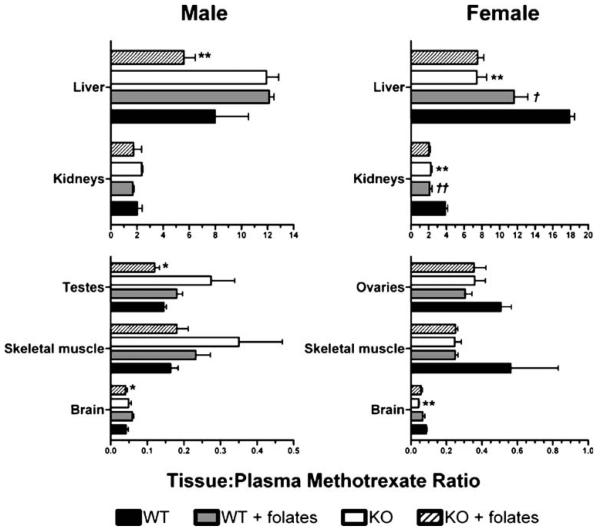
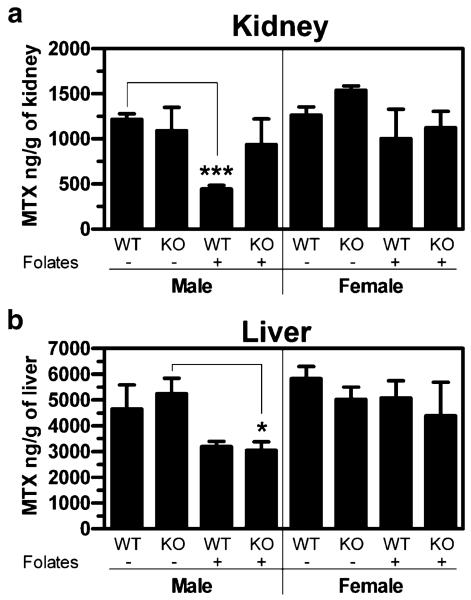
Results: NSAIDs, beta-lactams, and uremic toxins inhibited mOat3-mediated methotrexate uptake by 70-100%, while folate, leucovorin, and 5-methyltetrahydrofolate inhibited transport by 25-50%. A Km of 60.6 +/- 9.3 microM for methotrexate transport was determined. Oat3 knockout mice exhibited reduced methotrexate-to-inulin clearance ratios versus wildtype. Male wildtype mice, but not knockouts or females, demonstrated significantly accelerated methotrexate clearance in response to reduced folates. Reduced folates also markedly inhibited hepatic methotrexate accumulation in males, but not females, and the response was independent of Oat3 function.

Conclusions: Oat3 contributes to methotrexate clearance, but represents only one component responsible for methotrexate's elimination. Therefore, in patients, dysfunctional hOAT3 polymorphisms or drug competition for hOAT3 transport may severely impact methotrexate elimination only when redundant means of methotrexate removal are also compromised. Furthermore, the present findings suggest that reduced-folate administration only influences methotrexate disposition in males, with the renal reduced-folate response influenced by OAT3 function.


Figures

Fig. 1
Fig. 1
Transport of estrone-3-sulfate and MTX by murine Oat3. Uptake was measured for 10 min at room temperature in Chinese hamster ovary cells stably transfected with mOat3 (CHO-mOat3) or empty vector (CHO-FRT). a Uptake of [3H]estrone-3-sulfate (5 μM) in the presence or absence of probenecid (1 mM). b Uptake of [3H]MTX (1 μM) in the presence or absence of probenecid (1 mM). Asterisks represent significant differences from respective mOat3 control uptake (***, p<0.001). Values are mean±SE.
Fig. 2
Fig. 2
Timecourse and Michaelis–Menten Kinetics of MTX transport in CHO-mOat3 cells. a Uptake of [3H]MTX (1 μM) was measured for 1, 2, 5, 10, 30, and 90 min at room temperature in CHO-mOat3 and CHO-FRT cells in order to determine the linear accumulation phase. b Uptake of [3H]MTX (10, 25, 100, 250, and 500 μM) was measured for 5 min at room temperature in CHO-mOat3 and CHO-FRT cells in order to construct a saturation curve. The “corrected” curve was obtained by subtracting the background nonspecific uptake as measured in the CHO-FRT cells from mOat3-mediated uptake. c Lineweaver–Burk plot of the “corrected” uptake values. The estimated Km calculated from three independent experiments conducted in triplicate is 60.6±9.3 μM. Values are mean±SE.
Fig. 3
Fig. 3
Inhibition profile of organic anions competing with MTX transport in CHO-mOat3 cells. Uptake of [3H]MTX (10 μM) in CHO-mOat3 cells was measured for 10 min at room temperature in the presence (1 mM) or absence of organic anions, and the organic cation tetraethylammonium. Background in CHO-FRT cells was determined in the absence of inhibitor. Asterisks represent significant differences from CHO-mOat3 control (*, p<0.05; **, p<0.01; ***, p<0.001). Abbreviations: DOPAC (dihydroxyphenylacetic acid), 5-HIAA (5-hydroxyindoleacetic acid), 5-CHO-THF (5-formyltetrahydrofolate), and 5-CH3-THF (5-methyltetrahydrofolate). Values are mean±SE.
Fig. 4
Fig. 4
Plasma elimination of MTX in male wildtype and Oat3 knockout mice in the presence or absence of reduced folates. a Plasma elimination of [3H]MTX after a 2.45 μg/kg dose. b Plasma elimination of [3H]MTX after a 1.7 mg/kg dose. c Plasma elimination of [3H]MTX (1.7 mg/kg) in the presence of a tenfold molar excess of 5-methyltetrahydrofolate and 5-formyltetrahydrofolate (leucovorin). df Plasma elimination of [14C]inulin injected concomitantly with [3H]MTX (charts correspond vertically). Asterisks represent significant differences between the entire elimination curves using two-way ANOVA (**, p<0.01). Significant differences were present between the curves in c only. N=3 animals for each curve and values given are mean±SE. Note: units on y-axis of a are ng/ml.
Fig. 5
Fig. 5
Plasma elimination of MTX in female wildtype and Oat3 knockout mice in the presence or absence of reduced folates. a Plasma elimination of [3H]MTX after a 1.7 mg/kg dose. b Plasma elimination of [3H]MTX (1.7 mg/kg) in the presence of a tenfold molar excess of 5-methyltetrahydrofolate and 5-formyltetrahydrofolate (leucovorin). c and d Plasma elimination of [14C]inulin injected concomitantly with [3H]MTX (charts correspond vertically). Asterisks represent significant differences between the entire elimination curves using two-way ANOVA (**, p<0.01). Significant differences were present between the curves in a only. N=3 animals for each curve and values given are mean±SE.
Fig. 6
Fig. 6
MTX-to-inulin plasma clearance ratio comparing genotypes and genders. Ratios were determined using MTX and inulin plasma clearance values for each individual mouse. The mean inulin plasma clearance value for all mice in this investigation is considered typical (13.57±0.64 ml min−1 kg−1, n=30). a Comparison between wildtype (WT) and Oat3 knockout (KO) mice in the presence (denoted as+folates) or absence of reduced folates. b Comparison between male and female mice in the presence or absence of reduced folates. Asterisks represent significant differences between genotypes (a) and genders (b) or any other indicated bars (*, p<0.05). Clearance values were generated from the data used in Figs. 4 and 5. N=3 animals for each bar and values given are mean±SE. All ratios are calculated from data obtained in the “clinical dose” (i.e., 1.7 mg/kg) methotrexate experiments with the exception of “low dose” for males, which was obtained using data from the tracer dose experiment.
Fig. 7
Fig. 7
Tissue-to-plasma ratio of MTX in wildtype and Oat3 knockout mice in the presence or absence of reduced folates. Thirty minutes after IV bolus [3H]MTX (Figs. 4 and 5) in the presence or absence of reduced-folate inhibition, the indicated tissues were harvested and [3H]MTX levels were quantified. Thirty-minute plasma MTX levels were used to calculate the tissue-to-plasma ratios. Asterisks represent significant differences between wildtype and Oat3 knockout mice given the same treatment (i.e., with or without reduced-folate inhibition), and for the same tissue and gender (*, p<0.05; **, p<0.01). Daggers represent significant differences between mice of the same genotype in the presence or absence of folates (†, p<0.05; ‡, p<0.01). Values are mean±SE.
Fig. 8
Fig. 8
Absolute kidney and liver accumulation of MTX in wildtype and Oat3 knockout mice. Thirty minutes after IV bolus [3H]MTX (Figs. 4 and 5) in the presence or absence of reduced folates, kidneys (a) and liver (b) were harvested and [3H]MTX levels were quantified. WT, wildtype mice; KO, Oat3 knockout mice; –, absence of folates; +, presence of folates. Asterisks represent significant differences between the indicated bars (*, p<0.05). N=3 animals and values given are mean±SE.

Similar articles

Cited by

References

    1. Methotrexate DRUGDEX® Evaluations. n.d. Thomson Micro-medex. Mar. 14, 2007. Available at: http://www.thomsonhc.com.
    1. Widemann BC, Adamson PC. Understanding and managing methotrexate nephrotoxicity. Oncologist. 2006;11:694–703. - PubMed
    1. White JC, Goldman ID. Mechanism of action of methotrexate. IV. Free intracellular methotrexate required to suppress dihydrofolate reduction to tetrahydrofolate by Ehrlich ascites tumor cells in vitro. Mol. Pharmacol. 1976;12:711–719. - PubMed
    1. White JC, Loftfield S, Goldman ID. The mechanism of action of methotrexate. III. Requirement of free intracellular methotrexate for maximal suppression of (14C)formate incorporation into nucleic acids and protein. Mol. Pharmacol. 1975;11:287–297. - PubMed
    1. Wright SH, Dantzler WH. Molecular and cellular physiology of renal organic cation and anion transport. Physiol. Rev. 2004;84:987–1049. - PubMed

Publication types

Substances