. 2007 Sep;122(1):1-14.
doi: 10.1111/j.1365-2567.2007.02647.x. Epub 2007 Jul 28.

Characterization of human invariant natural killer T subsets in health and disease using a novel invariant natural killer T cell-clonotypic monoclonal antibody, 6B11

Affiliations

Characterization of human invariant natural killer T subsets in health and disease using a novel invariant natural killer T cell-clonotypic monoclonal antibody, 6B11

Carlos J Montoya et al. Immunology. 2007 Sep.

Abstract

Identification of human CD1d-restricted T-cell receptor (TCR)-invariant natural killer T (iNKT) cells has been dependent on utilizing combinations of monoclonal antibodies or CD1d tetramers, which do not allow for the most specific analysis of this T-cell subpopulation. A novel monoclonal antibody (clone 6B11), specific for the invariant CDR3 loop of human canonical Valpha24Jalpha18 TCR alpha chain, was developed and used to specifically characterize iNKT cells. In healthy individuals studied for up to 1 year, a wide but stable frequency of circulating iNKT cells (range: 0.01-0.92%) was observed, with no differences in frequency by gender. Four stable iNKT cell subsets were characterized in peripheral blood based on the expression of CD4 and CD8, with CD8(+) iNKT cells being a phenotypic and functionally different subset from CD4(+) and double negative iNKT cells; in particular, LAG-3 was preferentially expressed on CD8(+) iNKT cells. In addition, a strong negative linear correlation between the frequency of total iNKT cells and percentage of the CD4(+) subset was observed. In terms of their potential association with disease, patients at risk for type 1 diabetes had significantly expanded frequencies of double negative iNKT cells when compared to matched controls and first-degree relatives. Moreover, peripheral blood CD4(+) iNKT cells were the highest producers of interleukin-4, while the production of interferon-gamma and tumour necrosis factor-alpha was similar amongst all iNKT cell subsets. These differences in iNKT cell subsets suggest that in humans the relative ratio of iNKT cell subsets may influence susceptibility vs. resistance to immune-mediated diseases.


Figures
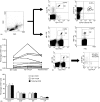
Figure 1
Figure 1
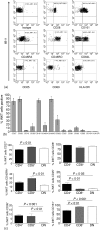
Frequency of iNKT cells and iNKT cell subsets in peripheral blood. (a) Representative profiles of iNKT cell frequencies detected in PBMC using anti-Vα24 and anti-Vβ11, human CD1d tetramers or 6B11 alone or in combination with anti-CD3. These representative plots show a similar frequency detection of iNKT cells in a region comprising the lymphocytes (R1, created from forward vs. side scatter). (b) Comparative analysis of the iNKT cell frequency in peripheral blood from healthy adult subjects (n = 10), showing that a similar percentage of iNKT cells in each individual is detected with these three combinations of reagents (mean ± standard deviation for the different combinations of reagents: 6B11 with anti-CD3 = 0·036 ± 0·030; anti-Vα24 and anti-Vβ11 = 0·055 ± 0·054; human CD1d tetramers with anti-CD3 = 0·040 ± 0·035). (c) Representative FACS used to quantitate CD4+, CD8+, CD4/CD8 (DN), and CD4+/CD8+ (DP) iNKT cell subsets (in 6B11+/CD3+ cells in this example). The percentage of iNKT cells expressing CD4 or CD8 was determined in a region (R2) comprising the 6B11+/CD3+ cells. (d) Analysis of the frequencies of iNKT cell subsets using anti-Vα24 and anti-Vβ11, human CD1d tetramers or 6B11 in combination with anti-CD3, and the co-expression of CD4 and CD8 (n = 10). No differences in the frequency of iNKT cell subsets detected with the different combinations of reagents were observed; the results are presented as the mean ± standard deviation.
Figure 2
Figure 2
Frequency of iNKT cells in a large cohort of healthy adult population. The percentage of peripheral blood iNKT cells was determined by flow cytometry analysis in 90 healthy adult individuals (50 female, 40 male), detecting at the lymphocyte's gate the cells positive for both 6B11 and CD3. There were no significant differences in the iNKT cell frequency among the total population (0·17%± 0·19%), female individuals (0·21%± 0·21%) and male subjects (0·14%± 0·13%). However, a heterogeneous distribution in iNKT cell frequency was observed in all the individuals, ranging from 0·01% to 0·92%(a). The same pattern of distribution was observed for female (b) and male (c) subgroups. Considering the mean value for iNKT cell frequency in all the study population (0·17%), the female subgroup had a trend to have a higher number of individuals with a higher frequency of iNKT cells (44%) than the male subgroup (25%).
Figure 3
Figure 3
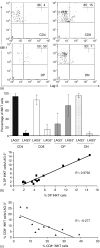
The percentage of CD4+ iNKT cells is inversely correlated to total iNKT cell frequency. The frequency of peripheral blood iNKT cells and their subsets were determined by flow cytometry in 30 healthy adults using mAbs 6B11 and anti-CD3, in combination with mAbs against CD4 and CD8 molecules. (a) The correlation analysis between the frequency of total iNKT cells and the percentage of iNKT cell subsets showed a negative correlation with the percentage of CD4+ iNKT cells (left panel) and a positive correlation with the percentage of DN iNKT cells (right panel). Based on this finding, these individuals were divided in two groups according to their mean frequency of iNKT cells (high-percentage donors, if iNKT cells were = 0·16%; and low-percentage donors, if iNKT cells were <0·16%). (b) Individuals with high frequency of iNKT cells had a significantly lower percentage of CD4+ iNKT cells and higher percentage of CD8+ and DN iNKT cells than subjects with low frequency of iNKT cells (P < 0·001, P = 0·02 and P < 0·001, respectively). The results are presented as the mean ± standard deviation of the percentage of iNKT cells expressing CD4 and/or CD8 molecules.
Figure 4
Figure 4
Phenotypic and functional surface markers expressed on resting peripheral blood iNKT cells. (a) Representative dot plots showing the expression of surface markers (percentage of positive cells, and MFI in those positive cells) on resting peripheral blood iNKT cells (6B11+ cells). (b) The frequency of iNKT cells expressing each surface marker was evaluated by flow cytometry staining using the mAb 6B11 (n = 10, 5 females and 5 males). While the expression of NK markers (CD16, CD56 and CD161) was variable, more than 80% of peripheral blood iNKT cells expressed CD27 and CD28 and have an effector memory phenotype (CD45ROhigh/CD62Llow). However, the expression of activation markers (CD25, CD38, CD69, CD95, CD154, HLA-DR) was very low. (c) Differences in surface markers expression by subsets of resting peripheral blood iNKT cells. 6B11 in combination with specific mAbs against CD4, CD8 and the surface molecules noted were used to evaluate cells gated on lymphocytes by FSC/SSC and defined as CD4+, CD8+, DN, or DP as in Figure 1. Very few DP events were detected for statistical analysis. The molecule CD27 was expressed by a significantly lower percentage of CD4+ iNKT cells, while a higher percentage of them expressed CD28, in comparison with CD8+and DN iNKT cells. CD45RA was expressed by a significantly higher percentage of CD8+ iNKT cells; CD25 was expressed by a significantly higher percentage of CD4+ iNKT cells; CD95 was expressed by a significantly lower percentage of DN iNKT cells, and CD161 was expressed by a significantly higher percentage of CD8+ and DN than CD4+ iNKT cells. The results are presented as the mean ± standard deviation of the percentage of iNKT cells expressing each molecule.
Figure 5
Figure 5
LAG-3 expression on resting peripheral blood iNKT cells. Expression of the CD4 homologue LAG3 is associated with co-expression of CD8. (a) Representative FACS profiles for LAG3 expression, determined on CD4+, CD8+, DP and DN iNKT cell subsets. (b) LAG3 expression on iNKT cell subsets: cumulative data for an additional cohort of 13 normal donors. The results are presented as the mean ± standard deviation of the percentage of iNKT cells expressing LAG3. (c) The expression of LAG3 is inversely related to the percentage of CD8+ iNKT cell frequency.
Figure 6
Figure 6
Cytokine profiles in subsets of iNKT cells activated ex vivo. PBMC from healthy individuals were suspended in complete culture media and incubated 6 hrs with PMA (50 ng/ml) and ionomycin (500 ng/ml); to block the secretion of the proteins synthesized and the down regulation of the TCR and CD4 molecules in response to activation, Brefeldin A (10 μg/ml) was added to the culture during the last 4 hrs of incubation. Cells were then stained for relevant cell surface while the production of cytokines was analyzed by intracellular staining. (a) Representative dot plots show the up-regulation of intracellular IFN-γ, IL-4 and TNF-α by peripheral blood iNKT cells (6B11+ cells) incubated with PMA/Ionomycin. (b) Activation-induced intracellular cytokine profiles for iNKT cell subsets. There were no significant differences in the up-regulation of IFN-γ and TNF-α expression among the different subsets of iNKT cells, while a significantly higher percentage of CD4+ iNKT cells expressed IL-4, in comparison to CD8+ and DN iNKT cells. The results are presented as the mean ± standard deviation of the absolute percentage of iNKT cells expressing each molecule, determined as: (% iNKT cells positive in activated samples) – (% iNKT cells positive in unstimulated samples).

References

    1. Wilson SB, Delovitch TL. Janus-like role of regulatory iNKT cells in autoimmune disease and tumor immunity. Nat Rev Immunol. 2003;3:211–22. - PubMed
    1. Godfrey DI, Hammond KJ, Poulton LD, Smyth MJ, Baxter AG. NKT cells: facts, functions and fallacies. Immunol Today. 2000;21:573–83. - PubMed
    1. Chen H, Paul WE. Cultured NK1.1+ CD4+ T cells produce large amounts of IL-4 and IFN-γ upon activation by anti-CD3 or CD1. J Immunol. 1997;159:2240–9. - PubMed
    1. Porcelli SA, Modlin RL. The CD1 system. antigen-presenting molecules for T cell recognition of lipids and glycolipids. Annu Rev Immunol. 1999;17:297–329. - PubMed
    1. Bendelac A, Rivera MN, Park HS, Roark JH. Mouse CD1-specific NK1 T cells: development, specifity and function. Annu Rev Immunol. 1997;15:535–62. - PubMed

Publication types