

The impact of a physical geographic barrier on the dynamics of measles
- PMID: 17662170
- PMCID: PMC2870857
- DOI: 10.1017/S0950268807009193
The impact of a physical geographic barrier on the dynamics of measles
Abstract
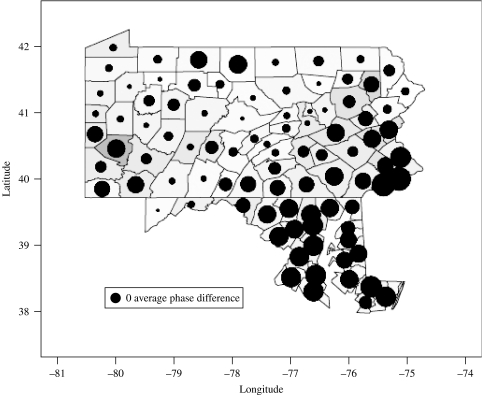
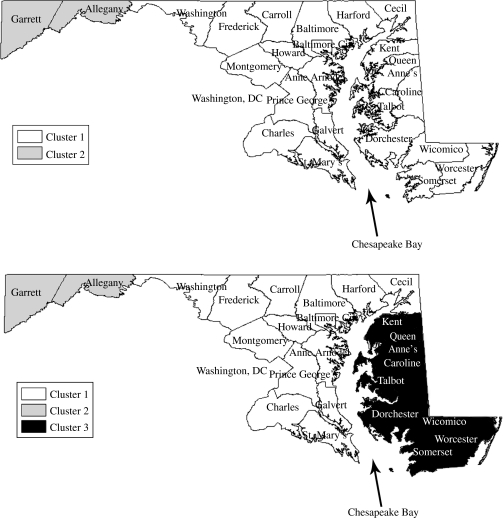
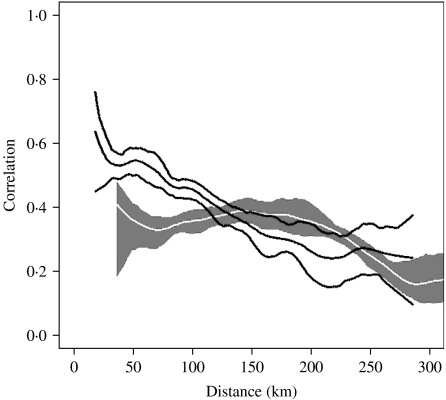
Spatial-temporal patterns of measles incidence reflect the spatial distribution of human hosts. The heterogeneous spatial distribution of communities has been shown to introduce spatially dependent temporal lags in the timing of measles incidence. Incidence patterns reflect internal dynamics within a community and coupling of communities through the movement of infectious individuals. The central role of human movement in coupling dynamics in separate communities suggests that physical geographic barriers to movement should reduce spatial-temporal correlation. We examine measles dynamics in Maryland and Pennsylvania during the period of 1917-1938. The central feature of interest is the Chesapeake Bay, which separates Maryland into two distinct regions. We find that correlation of measles incidences in communities separated by the bay is reduced compared to communities not separated by the bay, suggesting the bay acted as a barrier to human movement during this time sufficient to decouple measles dynamics in Maryland counties.
Figures
References
-
- London WP, Yorke JA. Recurrent outbreaks of measles, chickenpox and mumps. 1. Seasonal variation in contact rates. American Journal of Epidemiology. 1973;98:453–468. - PubMed
-
- Grenfell BT, Bolker BM. Cities and villages: infection hierarchies in a measles metapopulation. Ecology Letters. 1998;1:63–70.
-
- Earn DJD et al. A simple model for complex dynamical transitions in epidemics. Science. 2000;287:667–670. - PubMed
-
- Grenfell BT, Bjornstad ON, Finkenstadt BF. Dynamics of measles epidemics: scaling noise, determinism, and predictability with the TSIR model. Ecological Monographs. 2002;72:185–202.
-
- Bartlett MS. Deterministic and stochastic models for recurrent epidemics. Proceedings of the Third Berkeley Symposium on Mathematical Statistics and Probability. 1956;4:81–109.
Publication types
MeSH terms
Grants and funding
LinkOut - more resources
Full Text Sources
Medical
