. 2007 Jul 27;130(2):335-47.
doi: 10.1016/j.cell.2007.05.043.

A metabolic sensor governing cell size in bacteria

Affiliations

A metabolic sensor governing cell size in bacteria

Richard B Weart et al. Cell. .

Abstract

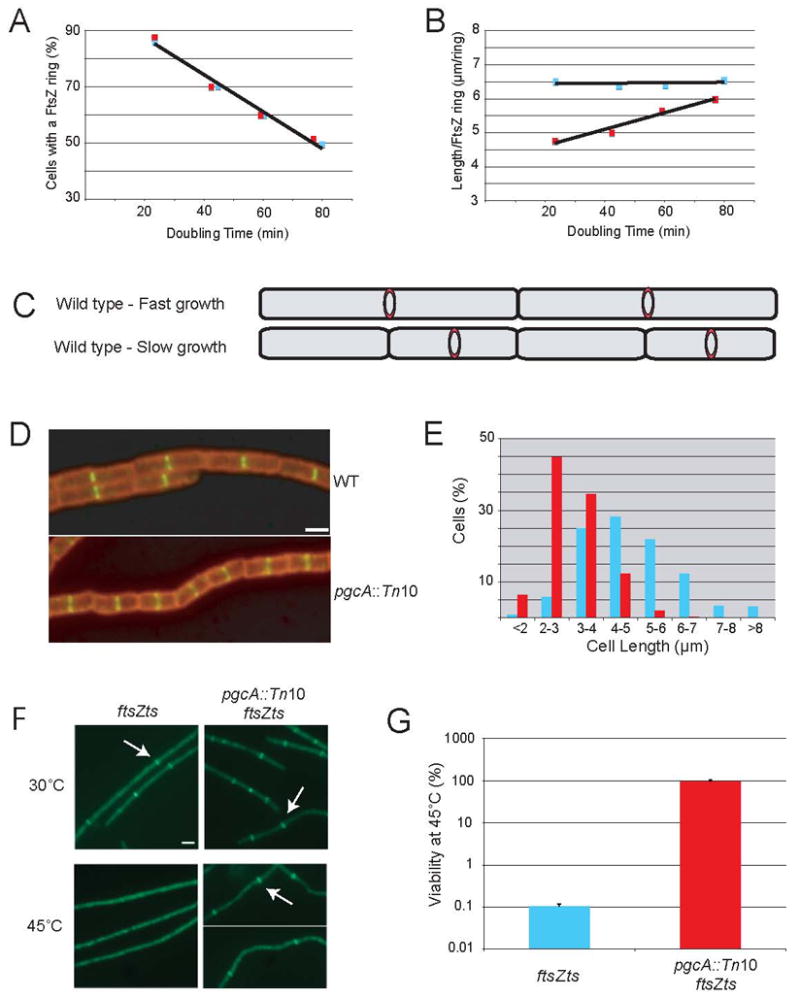
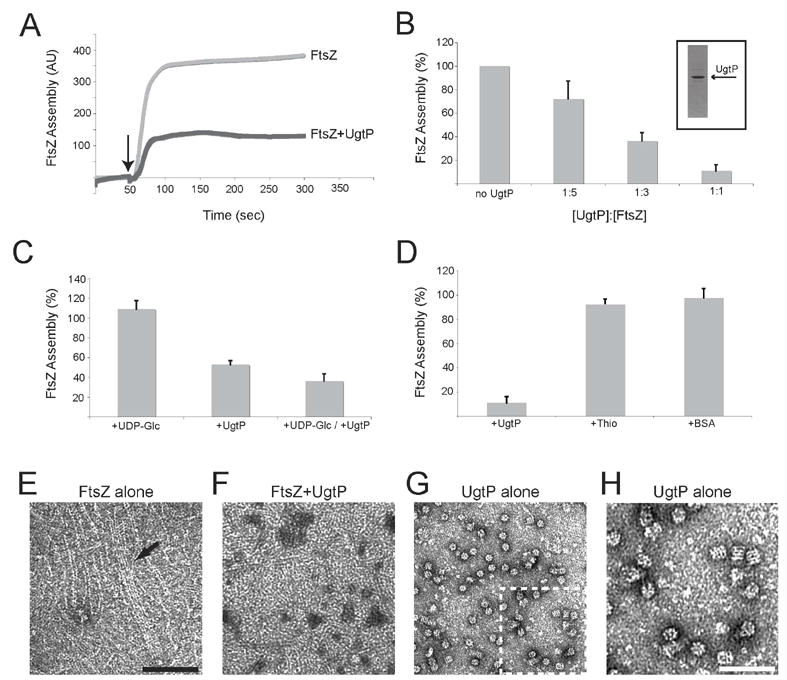
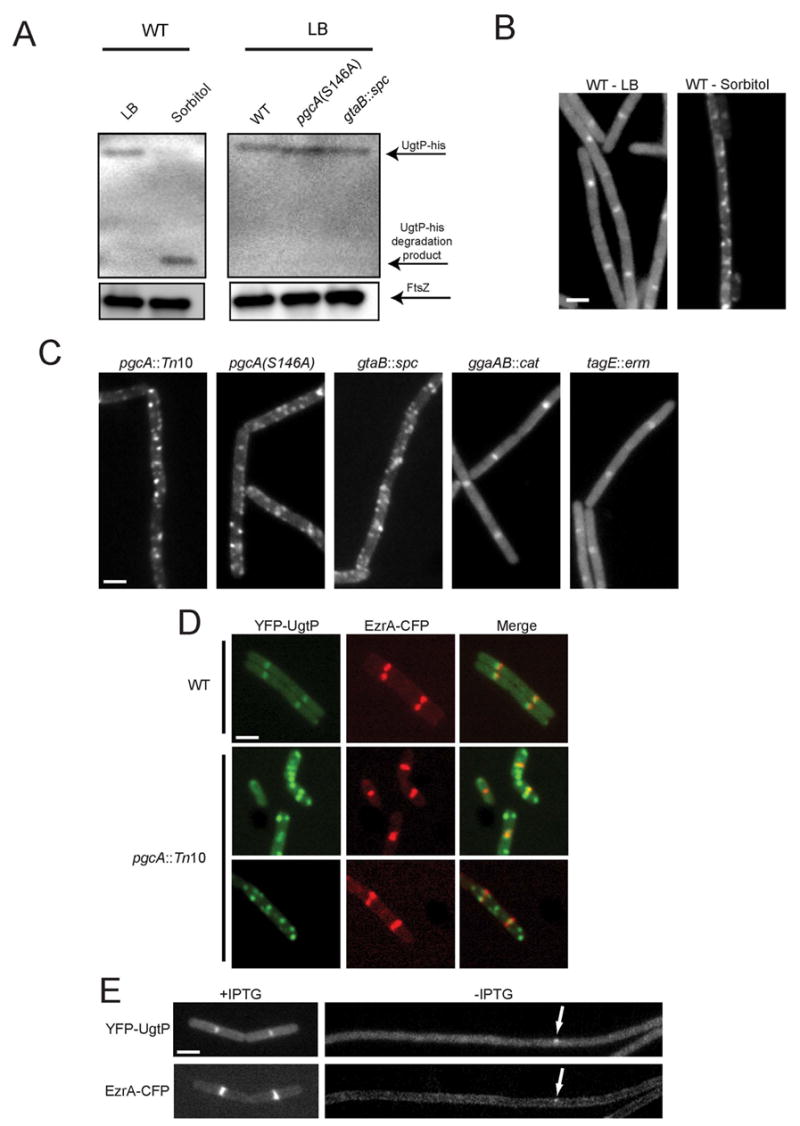
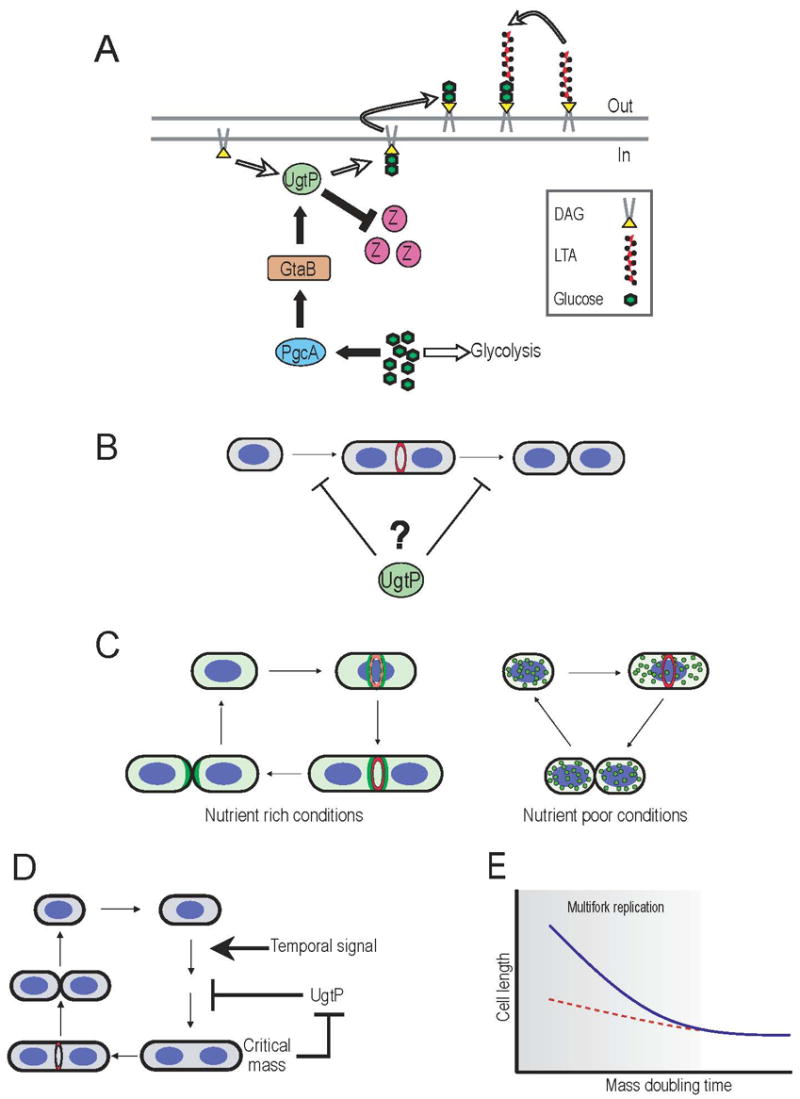
Nutrient availability is one of the strongest determinants of cell size. When grown in rich media, single-celled organisms such as yeast and bacteria can be up to twice the size of their slow-growing counterparts. The ability to modulate size in a nutrient-dependent manner requires cells to: (1) detect when they have reached the appropriate mass for a given growth rate and (2) transmit this information to the division apparatus. We report the identification of a metabolic sensor that couples nutritional availability to division in Bacillus subtilis. A key component of this sensor is an effector, UgtP, which localizes to the division site in a nutrient-dependent manner and inhibits assembly of the tubulin-like cell division protein FtsZ. This sensor serves to maintain a constant ratio of FtsZ rings to cell length regardless of growth rate and ensures that cells reach the appropriate mass and complete chromosome segregation prior to cytokinesis.


Figures

Figure 1
Figure 1. A regulator of FtsZ assembly that couples division to cell mass
Wild type (blue) and pgcA::Tn10 (red) cells were grown in LB, minimal glucose, minimal glycerol and minimal sorbitol to produce a range of doubling times. The percentage of cells displaying an FtsZ ring and the average length per FtsZ ring (L/R) were determined for both strains under all conditions. (A) The incidence of FtsZ ring formation was identical for wild type (blue) and pgcA::Tn10 mutant cells (red) cultured in four different growth conditions. (B) The L/R ratio for wild type cells (blue) is constant regardless of growth rate. In contrast, the L/R ratio for pgcA::Tn10 cells (red) increases as a function of doubling time and differs significantly from wild type (P < 0.001). (C) Cartoon depicting constant L/R ratio in fast and slow growing cells. (D) Wild type and pgcA::Tn10 cells after growth in LB. Cell wall - red, FtsZ - green. Bar = 2 μm. (E) Histogram of wild type (blue) and pgcA::Tn10 (red) cell lengths after growth in LB. pgcA::Tn10 cells were significantly shorter than wild type cells (P < 0.001). (F) pgcA+ cells bearing the ftsZts allele (ftsZ-gfp) form FtsZ rings at 30° C but not at 45° C. Disruption of pgcA restores FtsZ ring assembly to ftsZts cells at 45° C. Arrows indicate examples of FtsZ rings. Bar = 2 μm. (G) Disruption of pgcA restores viability ~1000-fold to ftsZts cells at 45° C. Error bars = standard deviation.
Figure 2
Figure 2. The last enzyme in the glucolipid biosynthesis pathway, UgtP, is an inhibitor of FtsZ assembly and cell division
(A) Simplified schematic of glucose utilization in B. subtilis. Enzymes (bold) were tested for their role in regulating FtsZ assembly and cell division. Only enzymes involved in glucolipid biosynthesis (*) were required for coupling FtsZ assembly and cell division to cell mass. (B) PgcA activity as measured by the conversion of Glc-1-P to Glc-6-P (Lazarevic et al., 2005). PgcA activity in the lysates of wild type cells cultured in LB and minimal sorbitol were 25.1 ± 0.6 and 12.9 ± 0.7 nmol min−1 mg−1 respectively. There was no detectable PgcA activity in pgcA::Tn10 and pgcA(S146A) lysates from LB cultures. (C) Micrographs of various strains. Mutations in the DiGlcDAG biosynthesis pathway result in abnormally short cells (P < 0.001). Bar = 2 μm. (D) Mutations that disrupt the synthesis of DiGlcDAG suppress the lethality of minCD overexpression. Error bars = standard deviations. (E) Cell size increases with increasing levels of UgtP. Histogram of cell lengths for cells encoding ugtP::cat (n=154, light grey), ugtP-his (n=147, dark grey) and ugtP-his thrC::Pxyl-ugtP-his (n=192, black) following growth in LB plus 0.5% xylose. Cells expressing ugtP-his from the native ugtP promoter displayed wild type cell length, whereas cells overexpressing ugtP-his ~8.5-fold from the xylose-inducible Pxyl promoter were ~22% longer (P < 0.001).
Figure 3
Figure 3. UgtP inhibits FtsZ assembly in vitro
(A–D) Thio-UgtP blocks FtsZ assembly in a 90° angle light scattering assay. FtsZ is at 6 μM in all reactions. Unless noted, all reactions contain 1 mM UDP-Glc and 1 mM GTP. Error bars = standard deviations. FtsZ assembly in (B–D) is expressed as the assembly of FtsZ in the presence of the component indicated relative to the absence of the component indicated. (A) A representative light scattering trace showing FtsZ assembly ± 2 μM Thio-UgtP. AU = arbitrary units. Arrow indicates addition of 1 mM GTP. (B) Concentration-dependent inhibition of FtsZ assembly by UgtP. The ratio of Thio-UgtP to FtsZ is shown beneath each bar. Purified Thio-UgtP is shown inset. (C) Inhibition of FtsZ assembly by 2 μM Thio-UgtP is only mildly stimulated by 1mM UDP-Glc. (D) FtsZ assembly in the presence of either 6 μM Thio-UgtP, Thioredoxin-his, or BSA. (E–H) Electron micrographs of FtsZ and UgtP. FtsZ is 2 μM and Thio-UgtP is 1 μM. All reactions were conducted in the presence of 1 mM UDP-Glc and 1 mM GTP. Bar = 100 nm for (E–G) and 50 nm for (H). (E) FtsZ alone. Arrow indicates bundle of polymers running the length of the micrograph. (F) FtsZ assembled in the presence of Thio-UgtP. Only short polymers are present and little bundling is observed. (G) Thio-UgtP oligomers formed in the absence of FtsZ. The selected region in (G) is shown at 2-fold greater magnification in (H).
Figure 4
Figure 4. Localization of the division inhibitor UgtP is dependent on UDP-Glc levels and FtsZ
(A) Quantitative immunoblot of UgtP-his (top arrow) expressed from the native ugtP promoter. UgtP levels were ~6-fold lower in cells cultured in minimal sorbitol relative to LB (left). Middle arrow indicates UgtP degradation product in minimal sorbitol. UgtP-his levels were not decreased in pgcA(S146A) or gtaB::spc cells relative to wild type cells when grown in LB (right). FtsZ (bottom arrow) is shown as a loading standard. (B) YFP-UgtP localizes to midcell and the poles of wild type cells cultured in LB (left) but shows a punctate localization pattern and decreased cytoplasmic staining in minimal sorbitol (right). (C) YFP-UgtP localization in various strains cultured in LB. The loss of pgcA results in a punctate UgtP localization pattern similar to that observed in wild type cells cultured in minimal sorbitol. (D) Colocalization YFP-UgtP and EzrA-CFP in cells cultured in LB: YFP-UgtP (left), EzrA-CFP (middle), merged image (right). Wild type (top row), pgcA::Tn10 (bottom rows). In contrast to wild type cells, YFP-UgtP foci typically do not co-localize with EzrA-CFP in the pgcA mutants. (E) YFP-UgtP (top) and EzrA-CFP (bottom) localization in cells cultured in LB before (left) and after (right) FtsZ depletion. YFP-UgtP is diffusely cytoplasmic in the absence of FtsZ. Occasional remaining foci of YFP-UgtP (top arrow) correspond to remaining foci of EzrA-CFP (bottom arrow). Bars = 2 μm.
Figure 5
Figure 5. The loss of pgcA uncouples chromosome segregation from division but does not disrupt nucleoid segregation or DNA replication
(A and B) The loss of pgcA promotes the formation of FtsZ rings over unsegregated nucleoids in LB (n=126) but not minimal sorbitol (n=59) relative to wild type cells (n=106 for LB, n=55 for minimal sorbitol, p < 0.001). (C) DNA (top) and FtsZ (bottom) in wild type (left) and pgcA::Tn10 (right) cells. Single arrows indicate FtsZ rings over segregated nucleoids. Double arrows indicate FtsZ rings over either unsegregated or partially segregated nucleoids. Bar = 2 μm. (D) Micrographs of pgcA::Tn10 spoIIIE::spc cells displaying chromosome bisection and anucleate phenotypes. Arrows indicate either bisected chromosomes or anucleate cells. Bar = 2 μm. (E) Histogram showing the number of foci of the origin binding protein Spo0J-GFP in wild type (blue, n=87) and pgcA::Tn10 (red, n=88) cells. (F and G) Flow cytometry of wild type and pgcA::Tn10 cells grown in the absence (F) or presence (G) of rifampicin to block replication initiation and cell division indicate that DNA replication is proceeding normally in the mutant strain. (H) Histogram indicating the number and conformation of nucleoids per cell for wild type (blue, n=50) and pgcA::Tn10 (red, n=50) cells. The reduced number of nucleoids in pgcA mutants suggests a delay in nucleoid segregation due to their short stature. (I) pgcA+ and pgcA::Tn10 cells depleted for FtsZ were stained for cell wall (red) and DNA (blue). Length per nucleoid was identical for both strains (~2.5 μm per nucleoid) indicating that nucleoid segregation is normal in the absence of septation in pgcA mutant cells.
Figure 6
Figure 6. A metabolic sensor coupling FtsZ assembly to cell mass and chromosome segregation
(A) In nutrient-rich media, abundant glucose results in high rates of flux through the glucolipid biosynthesis pathway (black arrows) driving UgtP to the septal site where it inhibits FtsZ assembly and delays maturation of the division apparatus. (B) UgtP delays division in short cells by inhibiting FtsZ assembly and/or extending the length of the Z period (C) Nutrient-dependent localization of UgtP couples maturation of the division apparatus to growth rate. Under nutrient-rich conditions (left), active UgtP (green) is distributed throughout the cytoplasm and concentrates at the cytokinetic ring (red) in an FtsZ-dependent manner. During growth in nutrient-poor medium (right), UgtP expression levels are reduced and the remaining protein is sequestered in randomly positioned foci. (D) A homeostatic circuit coordinates cell size with division on a cell autonomous level. A temporal signal “licenses” a bacterial cell to divide, however, UgtP-dependent inhibition of FtsZ assembly either delays FtsZ ring formation or extends the Z-period until the cell reaches critical mass. Once critical mass is achieved, a second nutrient-dependent sensor relieves division inhibition and permits progression through the remainder of the division cycle. (E) Carbon flow through the glucolipid biosynthesis pathway is responsible for the majority of the increase in cell size under conditions that promote multifork replication (shaded area). Wild type cells (blue line) cultured under nutrient-rich conditions are ~2-fold longer than their slow growing counterparts. In the absence of carbon flow through the glucolipid biosynthesis pathway (dashed red line) cell size remains relatively constant regardless of growth rate.

Comment in

References

    1. Bernhardt TG, de Boer PA. SlmA, a nucleoid-associated, FtsZ binding protein required for blocking septal ring assembly over Chromosomes in E. coli. Mol Cell. 2005;18:555–564. - PMC - PubMed
    1. Britton RA, Grossman AD. Synthetic lethal phenotypes caused by mutations affecting chromosome partitioning in Bacillus subtilis. J Bacteriol. 1999;181:5860–5864. - PMC - PubMed
    1. Cao M, Helmann JD. The Bacillus subtilis extracytoplasmic-function sigmaX factor regulates modification of the cell envelope and resistance to cationic antimicrobial peptides. J Bacteriol. 2004;186:1136–1146. - PMC - PubMed
    1. Chivers PT, Sauer RT. NikR is a ribbon-helix-helix DNA-binding protein. Protein Sci. 1999;8:2494–2500. - PMC - PubMed
    1. Cooper S, Helmstetter CE. Chromosome replication and the division cycle of Escherichia coli B/r. J Mol Biol. 1968;31:519–540. - PubMed

Publication types

MeSH terms