

Calcium-induced precipitate formation in brain mitochondria: composition, calcium capacity, and retention
- PMID: 17663756
- PMCID: PMC2566803
- DOI: 10.1111/j.1471-4159.2007.04626.x
Calcium-induced precipitate formation in brain mitochondria: composition, calcium capacity, and retention
Abstract
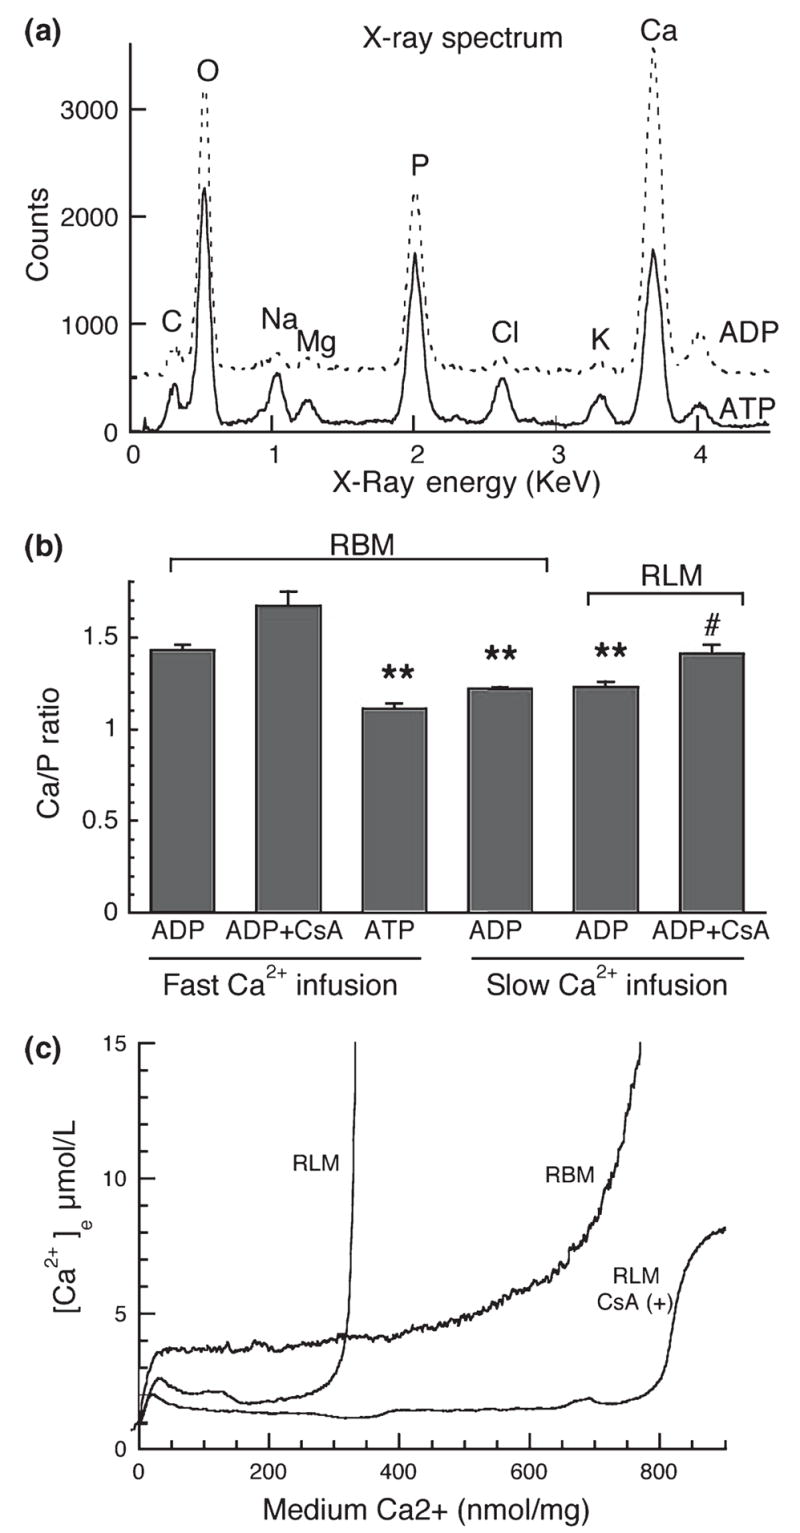
Both isolated brain mitochondria and mitochondria in intact neurons are capable of accumulating large amounts of calcium, which leads to formation in the matrix of calcium- and phosphorus-rich precipitates, the chemical composition of which is largely unknown. Here, we have used inhibitors of the mitochondrial permeability transition (MPT) to determine how the amount and rate of mitochondrial calcium uptake relate to mitochondrial morphology, precipitate composition, and precipitate retention. Using isolated rat brain (RBM) or liver mitochondria (RLM) Ca(2+)-loaded by continuous cation infusion, precipitate composition was measured in situ in parallel with Ca(2+) uptake and mitochondrial swelling. In RBM, the endogenous MPT inhibitors adenosine 5'-diphosphate (ADP) and adenosine 5'-triphosphate (ATP) increased mitochondrial Ca(2+) loading capacity and facilitated formation of precipitates. In the presence of ADP, the Ca/P ratio approached 1.5, while ATP or reduced infusion rates decreased this ratio towards 1.0, indicating that precipitate chemical form varies with the conditions of loading. In both RBM and RLM, the presence of cyclosporine A in addition to ADP increased the Ca(2+) capacity and precipitate Ca/P ratio. Following MPT and/or depolarization, the release of accumulated Ca(2+) is rapid but incomplete; significant residual calcium in the form of precipitates is retained in damaged mitochondria for prolonged periods.
Figures


Similar articles
-
Heterogeneity of the calcium-induced permeability transition in isolated non-synaptic brain mitochondria.J Neurochem. 2002 Dec;83(6):1297-308. doi: 10.1046/j.1471-4159.2002.01238.x. J Neurochem. 2002. PMID: 12472884
-
Inhibitory effects of adenine nucleotides on brain mitochondrial permeability transition.Neurochem Res. 2010 Nov;35(11):1667-74. doi: 10.1007/s11064-010-0228-x. Epub 2010 Jul 22. Neurochem Res. 2010. PMID: 20652632
-
Quantitative evaluation of the effects of mitochondrial permeability transition pore modifiers on accumulation of calcium phosphate: comparison of rat liver and brain mitochondria.Arch Biochem Biophys. 2004 Apr 1;424(1):44-52. doi: 10.1016/j.abb.2004.01.013. Arch Biochem Biophys. 2004. PMID: 15019835
-
Mitochondrial Cyclosporine A-Independent Palmitate/Ca2+-Induced Permeability Transition Pore (PA-mPT Pore) and Its Role in Mitochondrial Function and Protection against Calcium Overload and Glutamate Toxicity.Cells. 2021 Jan 11;10(1):125. doi: 10.3390/cells10010125. Cells. 2021. PMID: 33440765 Free PMC article. Review.
-
The mitochondrial permeability transition: the brain's point of view.Biochem Soc Symp. 1999;66:75-84. doi: 10.1042/bss0660075. Biochem Soc Symp. 1999. PMID: 10989659 Review.
Cited by
-
Regulation of Mitochondrial Permeability Transition Pore Opening by Monovalent Cations in Liver Mitochondria.Int J Mol Sci. 2023 May 25;24(11):9237. doi: 10.3390/ijms24119237. Int J Mol Sci. 2023. PMID: 37298189 Free PMC article.
-
Insight into Calcium-Binding Motifs of Intrinsically Disordered Proteins.Biomolecules. 2021 Aug 9;11(8):1173. doi: 10.3390/biom11081173. Biomolecules. 2021. PMID: 34439840 Free PMC article.
-
Infusion of Plasma from Exercised Mice Ameliorates Cognitive Dysfunction by Increasing Hippocampal Neuroplasticity and Mitochondrial Functions in 3xTg-AD Mice.Int J Mol Sci. 2020 May 6;21(9):3291. doi: 10.3390/ijms21093291. Int J Mol Sci. 2020. PMID: 32384696 Free PMC article.
-
Modeling the calcium sequestration system in isolated guinea pig cardiac mitochondria.J Bioenerg Biomembr. 2013 Jun;45(3):177-88. doi: 10.1007/s10863-012-9488-2. Epub 2012 Nov 22. J Bioenerg Biomembr. 2013. PMID: 23180139 Free PMC article.
-
Cyclosporin A Increases Mitochondrial Buffering of Calcium: An Additional Mechanism in Delaying Mitochondrial Permeability Transition Pore Opening.Cells. 2019 Sep 7;8(9):1052. doi: 10.3390/cells8091052. Cells. 2019. PMID: 31500337 Free PMC article.
References
-
- Andreyev A, Fiskum G. Calcium induced release of mitochondrial cytochrome c by different mechanisms selective for brain versus liver. Cell Death Differ. 1999;6:825–832. - PubMed
-
- Bernardi P. Mitochondrial transport of cations: channels, exchangers, and permeability transition. Physiol Rev. 1999;79:1127–1155. - PubMed
-
- Bernardi P, Krauskopf A, Basso E, Petronilli V, Blachly-Dyson E, Di Lisa F, Forte MA. The mitochondrial permeability transition from in vitro artifact to disease target. FEBS J. 2006;273:2077–2099. - PubMed
-
- Brown MR, Sullivan PG, Geddes JW. Synaptic mitochondria are more susceptible to Ca2+ overload than nonsynaptic mitochondria. J Biol Chem. 2006;281:11658–11668. - PubMed
Publication types
MeSH terms
Substances
Grants and funding
LinkOut - more resources
Full Text Sources
Miscellaneous
