. 2007 Jul 31:8:258.
doi: 10.1186/1471-2164-8-258.

EGFR associated expression profiles vary with breast tumor subtype

Affiliations

EGFR associated expression profiles vary with breast tumor subtype

Katherine A Hoadley et al. BMC Genomics. .

Abstract

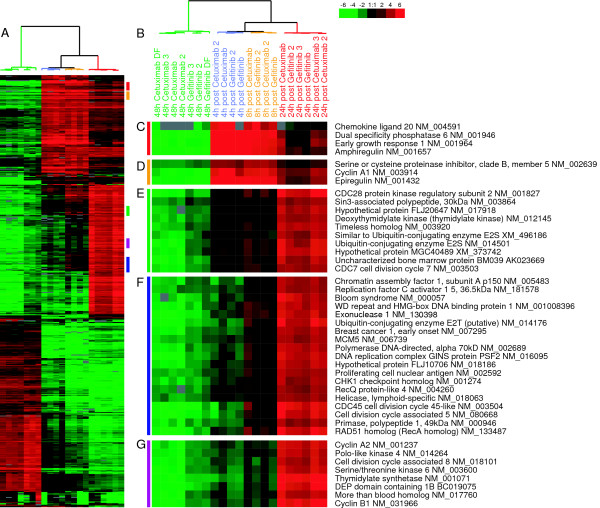
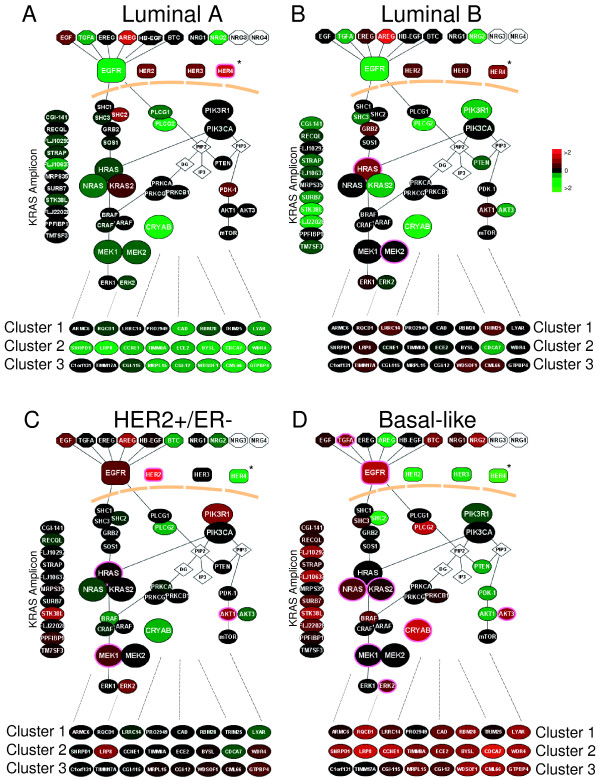
Background: The epidermal growth factor receptor (EGFR/HER1) and its downstream signaling events are important for regulating cell growth and behavior in many epithelial tumors types. In breast cancer, the role of EGFR is complex and appears to vary relative to important clinical features including estrogen receptor (ER) status. To investigate EGFR-signaling using a genomics approach, several breast basal-like and luminal epithelial cell lines were examined for sensitivity to EGFR inhibitors. An EGFR-associated gene expression signature was identified in the basal-like SUM102 cell line and was used to classify a diverse set of sporadic breast tumors.

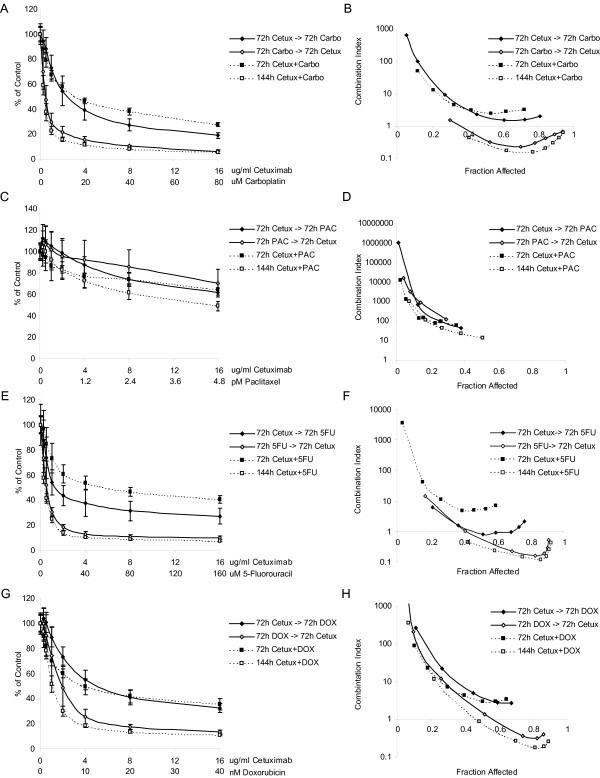
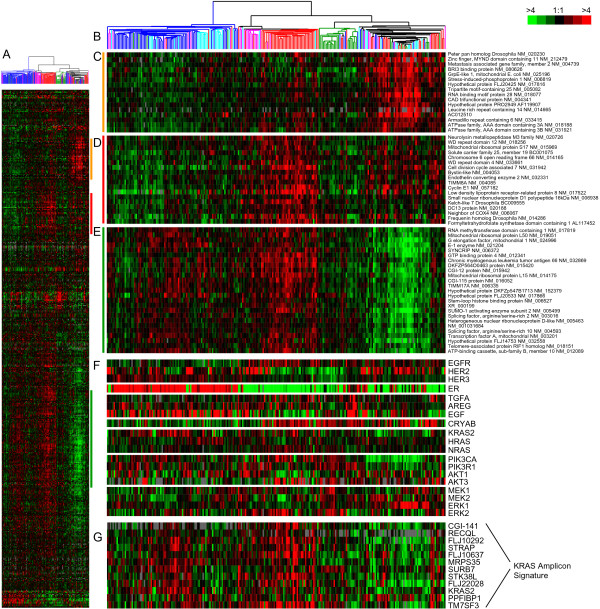
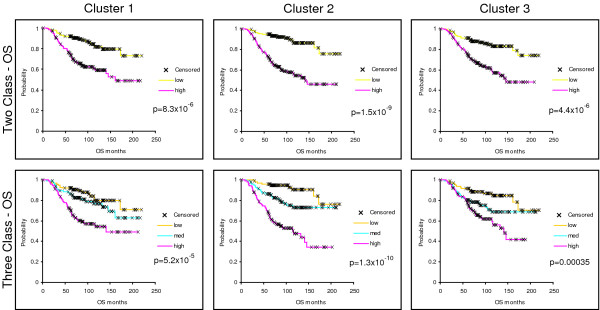
Results: In vitro, breast basal-like cell lines were more sensitive to EGFR inhibitors compared to luminal cell lines. The basal-like tumor derived lines were also the most sensitive to carboplatin, which acted synergistically with cetuximab. An EGFR-associated signature was developed in vitro, evaluated on 241 primary breast tumors; three distinct clusters of genes were evident in vivo, two of which were predictive of poor patient outcomes. These EGFR-associated poor prognostic signatures were highly expressed in almost all basal-like tumors and many of the HER2+/ER- and Luminal B tumors.

Conclusion: These results suggest that breast basal-like cell lines are sensitive to EGFR inhibitors and carboplatin, and this combination may also be synergistic. In vivo, the EGFR-signatures were of prognostic value, were associated with tumor subtype, and were uniquely associated with the high expression of distinct EGFR-RAS-MEK pathway genes.


Figures

Figure 1
Figure 1
Effects of different combination schedules of cetuximab with chemotherapeutics in SUM102 cells. Cells were treated with four different combination schedules: 1) 72 h cetuximab followed by 72 h chemotherapy, 2) 72 h chemotherapy followed by 72 h cetuximab, 3) 72 h concurrent chemotherapy and cetuximab, and 4) 144 h concurrent chemotherapy and cetuximab. A) Growth inhibitory effects of cetuximab and carboplatin combinations. B) Combination analysis of cetuximab and carboplatin treatments. C) Growth inhibitory effects of cetuximab and paclitaxel combinations. D) Combination analysis of cetuximab and paclitaxel treatments. E) Growth inhibitory effects of cetuximab and 5-fluorouracil combinations. F) Combination analysis of cetuximab and 5-fluorouracil treatments. G) Growth inhibitory effects of cetuximab and doxorubicin combinations. H) Combination analysis of cetuximab and doxorubicin treatments. Combination Index (CI) values below one are synergistic, equal to one are additive, and greater than one are antagonistic.
Figure 2
Figure 2
Gene expression patterns for SUM102 cells treated with gefitinib or cetuximab. Unsupervised hierarchical cluster analysis was performed on 48 h inhibitor treated and 4 h, 8 h, and 24 h post 48 hr inhibitor treated samples. A) The complete cluster overview with the colored bars indicating the location of the clusters shown in C-G. B) Close up of the experimental sample associated dendrogram. C+D) 4 h and 8 h post treatment induced genes including the EGFR ligands Amphiregulin and Epiregulin. E) Genes involved with the G1/S phase transition induced beginning in the 4 h post inhibitor and continuing though 24 h. F) Genes involved in DNA synthesis induced at 8 h post inhibitor and continuing through 24 h. G) Proliferation genes typically observed in tumor derived profiles including STK6 and Cyclin B1.
Figure 3
Figure 3
In vivo EGFR-associated profiles and additional genes implicated in the EGFR-RAS-MEK pathway. A) The top 500 induced genes from the SUM102 post treatment experiments were hierarchical clustered using the 248 UNC tumors. Colored bars indicate the location of the three clusters in D-E. B) Tumor associated dendrogram color coded according to tumor subtype: Luminal A – dark blue, Luminal B – light blue, true normals and normal-like – green, HER2+/ER-negative – pink, and basal-like – red. C) Cluster #1 that identified a mixed group of tumors. D) Selected genes from the center of Cluster #2 that are high in most basal-like tumors. E) Selected genes from the center of Cluster #3 that are high in the luminal tumors. F) Data for genes with suggested roles in EGFR-pathway. G) Data for the KRAS-amplicon signature identified in Herschkowitz et al. [35].
Figure 4
Figure 4
Kaplan-Meier survival plots for the 295 NKI tumors/patients using the in vivo defined EGFR-associated profiles. The average expression value for each cluster in each patient was determined and the patients then put into rank-order and divided into two equal groups or three equal groups. Overall survival analysis was performed for each cluster. X indicates censored data due loss to follow-up or to information at last checkup. Note that Clusters #2 and #3 were also similarly prognostic for the UNC 248 training data set.
Figure 5
Figure 5
EGFR pathway diagram displayed for each breast tumor subtype. The average gene expression value for each gene within each subtype is displayed for the EGFR-pathway and for the three EGFR-activation profiles using the UNC 248 tumor dataset. Eight genes from the middle of each of the three EGFR-activation clusters were used to view expression of the clusters in each of the subtypes. A pink node border identifies the genes that showed statistically significant associations with subtype. *Note: the NKI HER4 data spot was used since HER4 was not present in the UNC data set. A) Luminal A, B) Luminal B, C) HER2+/ER- and D) Basal-like.

References

    1. Yarden Y, Sliwkowski MX. Untangling the ErbB signalling network. Nat Rev Mol Cell Biol. 2001;2:127–137. doi: 10.1038/35052073. - DOI - PubMed
    1. Sørlie T, Perou CM, Tibshirani R, Aas T, Geisler S, Johnsen H, Hastie T, Eisen MB, van de Rijn M, Jeffrey SS, Thorsen T, Quist H, Matese JC, Brown PO, Botstein D, Eystein Lonning P, Borresen-Dale AL. Gene expression patterns of breast carcinomas distinguish tumor subclasses with clinical implications. Proc Natl Acad Sci U S A. 2001;98:10869–10874. doi: 10.1073/pnas.191367098. - DOI - PMC - PubMed
    1. Sørlie T, Tibshirani R, Parker J, Hastie T, Marron JS, Nobel A, Deng S, Johnsen H, Pesich R, Geisler S, Demeter J, Perou CM, Lonning PE, Brown PO, Borresen-Dale AL, Botstein D. Repeated observation of breast tumor subtypes in independent gene expression data sets. Proc Natl Acad Sci U S A. 2003;100:8418–8423. doi: 10.1073/pnas.0932692100. - DOI - PMC - PubMed
    1. Perou CM, Sørlie T, Eisen MB, van de Rijn M, Jeffrey SS, Rees CA, Pollack JR, Ross DT, Johnsen H, Akslen LA, Fluge O, Pergamenschikov A, Williams C, Zhu SX, Lonning PE, Borresen-Dale AL, Brown PO, Botstein D. Molecular portraits of human breast tumours. Nature. 2000;406:747–752. doi: 10.1038/35021093. - DOI - PubMed
    1. Hu Z, Troester M, Perou CM. High reproducibility using sodium hydroxide-stripped long oligonucleotide DNA microarrays. Biotechniques. 2005;38:121–124. - PubMed

Publication types

MeSH terms