. 2007 Nov;75(11):5210-22.
doi: 10.1128/IAI.00624-07. Epub 2007 Jul 30.

Impaired expression of perforin and granulysin in CD8+ T cells at the site of infection in human chronic pulmonary tuberculosis

Affiliations

Impaired expression of perforin and granulysin in CD8+ T cells at the site of infection in human chronic pulmonary tuberculosis

Jan Andersson et al. Infect Immun. 2007 Nov.

Abstract

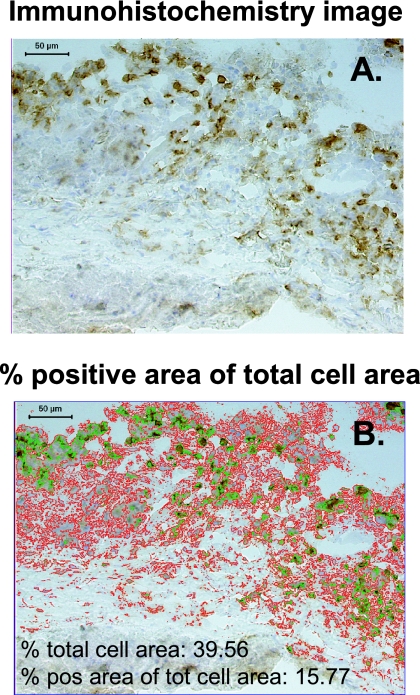
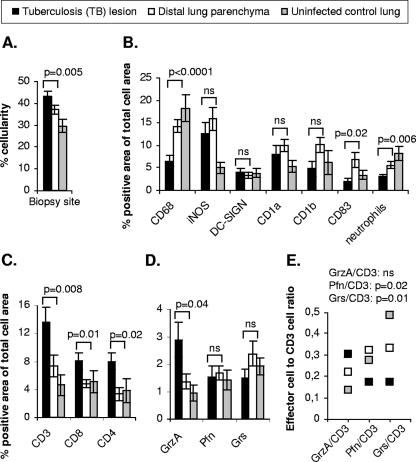
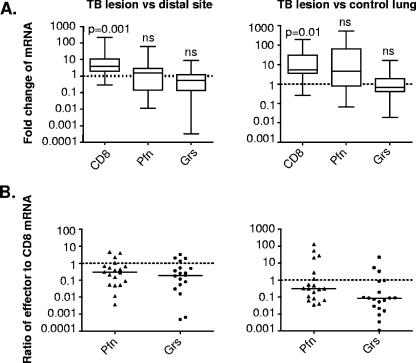
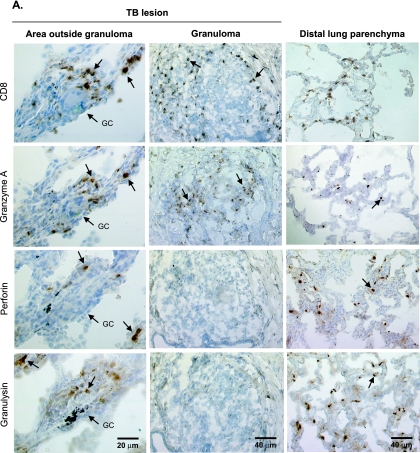
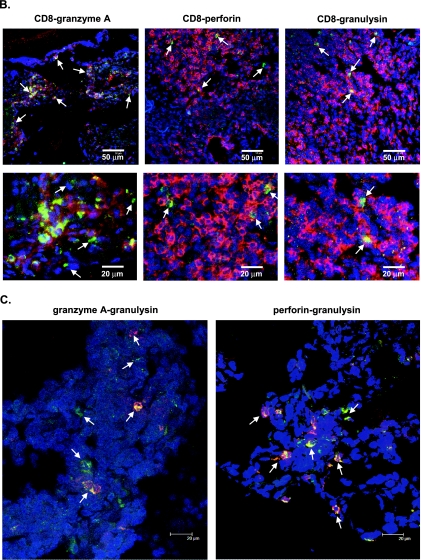
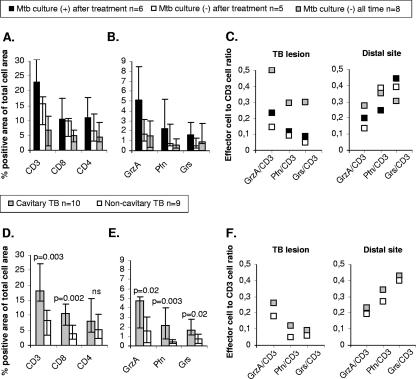
Protective immunity in tuberculosis is dependent on the coordinated release of cytolytic effector molecules from effector T cells and the subsequent granule-associated killing of infected target cells. In this study, we investigated the expression of cytolytic (perforin and granzyme A) and antimicrobial (granulysin) molecules at the single-cell level in cryopreserved lung tissue from patients with chronic, progressive tuberculosis disease. Quantification of protein-expressing cells was performed by in situ imaging, while mRNA levels in the infected tissue were analyzed by real-time PCR. Persistent inflammation, including excessive expression of inducible nitric oxide synthase in CD68+ macrophages and significant infiltration of CD3+, CD8+ and CD4+ T cells, was evident in tuberculosis lesions in all patients. However, despite the accumulation of CD3+ T cells, perforin- and granulysin-expressing CD3+ T cells were detected at two- to threefold-lower ratios in the tuberculosis lesions than in distal lung parenchyma and uninfected control lungs, respectively. This was evident at both the protein and mRNA levels. Moreover, perforin- and granulysin-expressing CD8+ T cells were scarce in individual granulomas within the tuberculosis lesions. In contrast, significant up-regulation of granzyme A-expressing CD3+ T cells was evident in the lesions from all patients. Confocal microscopy revealed coexpression of perforin and granulysin, primarily in CD8+ T cells; however, this expression was lower in the tuberculosis lesions. These findings suggest that symptomatic, chronic tuberculosis disease is associated with insufficient up-regulation of perforin and granulysin coexpression in CD8+ T cells at the local site of infection.


Figures

FIG. 1.
FIG. 1.
Protein expression in tissue quantified using acquired computerized image analysis of immunohistochemistry data. The images show the lymphocyte cuff at the edge of a necrotic granuloma. Positive immunostaining for CD3+ T cells is brown (diaminobenzidine staining), whereas cell nuclei are counterstained blue with hematoxylin. Magnification, ×125. (A) Blank immunohistochemistry image of the field that was analyzed. (B) Overlay image summarizing the analysis of the field in panel A. The positively stained area was marked (green contour line) by setting the threshold for the intensity of the positive staining of the image, whereas the total cellular area (red contour line) was marked by including the positively stained area as well as the nuclear and cytoplasmic area visualized in the field. Artifacts or acellular areas of necrosis were excluded from the analysis using the tissue excluder function of the software program. The field statistics show the percent total cell area and the percent positive area of the total cell area. Positive cells were generally quantified in 20 to 50 high-power fields by scanning the whole tissue section. A mean value for the percent positive area of the total cell area was finally determined. pos, positive; tot, total.
FIG. 2.
FIG. 2.
Expression and distribution of APCs, neutrophils, T cells, and cytolytic effector molecules in pulmonary tissue as assessed by in situ imaging. (A) Mean cellularity ± standard error of the TB lesions, distal lung parenchyma, and uninfected control lung estimated in the analysis. (B) Mean expression ± standard error of the indicated markers in the TB lesions, the distal lung parenchyma, and uninfected control. The statistical significance of differences in cellularity and protein expression was determined by a paired t test (TB lesion versus distal lung parenchyma). (C and D) Mean expression ± standard error of (C) CD3-, CD8-, and CD4-positive cells and (D) the cytolytic effector molecules granzyme A (GrzA), perforin (Pfn), and granulysin (Grs) in the TB lesions, distal lung parenchyma, and uninfected control. CD4 expression in the distal lung parenchyma was determined by two-color staining of CD3+ CD4+ T cells because this site included CD4+ T cells and CD3 CD4+ macrophages. The statistical significance of differences in protein expression was determined by a paired t test (TB lesion versus distal lung parenchyma). (E) Ratios of granzyme A, perforin, and granulysin expression to CD3 T-cell expression in the TB lesions, distal lung parenchyma, and uninfected control lung. The mean values for paired expression of effectors and CD3 T cells from all individual patients are shown. The statistical significance of differences in the effector cell/CD3 cell ratio among the different clinical groups was determined by one-way ANOVA. ns, not significant (P > 0.05).
FIG. 3.
FIG. 3.
mRNA expression of CD8, perforin, and granulysin as assessed by quantitative real-time PCR. (A) Fold changes in the ratios of CD8, perforin (Pfn), and granulysin (Grs) mRNA to ubiquitin C mRNA in the TB lesions compared to those in distal lung tissue or uninfected control lung tissue. The data are presented as a box and whisker plot. The statistical significance of differences in mRNA levels was determined by a paired t test (TB lesion versus distal lung parenchyma) or an unpaired t test (TB lesion versus uninfected control lung). ns, not significant (P > 0.05). (B) Ratios of relative expression of perforin and granulysin to CD8 mRNA levels in the TB lesions compared to those in the distal sites or uninfected control lung for individual patients. The data are expressed as the ratios of effector levels to CD8 mRNA levels in a scatter plot, and the solid bars indicate the medians.
FIG. 4.
FIG. 4.
Immunohistochemical analysis and confocal microscopy showing local distribution and coexpression of CD8+ T cells, granzyme A, perforin, and granulysin. (A) Giant cell (GC) formation (left panels) and a granuloma (middle panels) as characteristic morphological structures in a TB lesion. CD8-, granzyme A-, perforin-, and granulysin-expressing cells in serial sections of an area outside a distinct granuloma (left panels) or inside a distinct granuloma (middle panels) within a TB lesion were compared to cells in distal lung parenchyma (right panels) from a patient with cavitary TB. The arrows indicate positive cells (brown diaminobenzidine staining). Cell nuclei were counterstained blue with hematoxylin. Magnification of giant cell images, ×250; magnification of granuloma and distal lung images, ×125. (B) Two-color confocal immunofluorescent staining of CD8 (red; Alexa-633) and the granular markers granzyme A, perforin, and granulysin (green; Alexa-488) in the TB lesion from a patient with cavitary TB. The CD8+ T-cell-rich area shown facilitates visualization of CD8+ T cells that express the cytolytic effector molecules (see Table 2). Single-positive cells are red or green, whereas double-positive cells are yellow. The arrows in the upper panels indicate double-positive cells, and the arrows in the lower panels indicate granzyme A single-positive cells (green) and CD8-perforin or CD8-granulysin double-positive cells (yellow). Magnification for upper panels, ×125. The lower panels are close-up views of selected areas from the upper panels. (C) Dual staining of granulysin (red; Alexa-594) and granzyme A or perforin (green; Alexa-488) in the TB lesion from a patient with cavitary TB. Magnification, ×600. The arrows indicate both single-positive cells (green or red) and double-positive cells (yellow).
FIG. 4.
FIG. 4.
Immunohistochemical analysis and confocal microscopy showing local distribution and coexpression of CD8+ T cells, granzyme A, perforin, and granulysin. (A) Giant cell (GC) formation (left panels) and a granuloma (middle panels) as characteristic morphological structures in a TB lesion. CD8-, granzyme A-, perforin-, and granulysin-expressing cells in serial sections of an area outside a distinct granuloma (left panels) or inside a distinct granuloma (middle panels) within a TB lesion were compared to cells in distal lung parenchyma (right panels) from a patient with cavitary TB. The arrows indicate positive cells (brown diaminobenzidine staining). Cell nuclei were counterstained blue with hematoxylin. Magnification of giant cell images, ×250; magnification of granuloma and distal lung images, ×125. (B) Two-color confocal immunofluorescent staining of CD8 (red; Alexa-633) and the granular markers granzyme A, perforin, and granulysin (green; Alexa-488) in the TB lesion from a patient with cavitary TB. The CD8+ T-cell-rich area shown facilitates visualization of CD8+ T cells that express the cytolytic effector molecules (see Table 2). Single-positive cells are red or green, whereas double-positive cells are yellow. The arrows in the upper panels indicate double-positive cells, and the arrows in the lower panels indicate granzyme A single-positive cells (green) and CD8-perforin or CD8-granulysin double-positive cells (yellow). Magnification for upper panels, ×125. The lower panels are close-up views of selected areas from the upper panels. (C) Dual staining of granulysin (red; Alexa-594) and granzyme A or perforin (green; Alexa-488) in the TB lesion from a patient with cavitary TB. Magnification, ×600. The arrows indicate both single-positive cells (green or red) and double-positive cells (yellow).
FIG. 5.
FIG. 5.
Differences in expression of T cells and cytolytic effector molecules in the TB lesions. (A and B) Medians ± interquartile ranges for (A) CD3, CD8, and CD4 and (B) granzyme A (GrzA), perforin (Pfn), and granulysin (Grs) in TB lesions from patients that were culture positive for M. tuberculosis (Mtb) before and after treatment, patients that were culture positive before treatment but negative after treatment, and patients that were consistently culture negative. Differences in protein expression were determined to be not significant using a nonparametric Kruskal-Wallis test. (C) Ratio of granzyme A-, perforin-, and granulysin-expressing cells to CD3 T-cell expression in the TB lesions and distal lung parenchyma. The mean values for paired expression of effector cells and CD3 T cells from M. tuberculosis culture-positive and M. tuberculosis culture-negative patients are shown. (D and E) Median values ± interquartile ranges for (D) CD3, CD8, and CD4 and (E) granzyme A, perforin, and granulysin in TB lesions from patients with either the cavitary or noncavitary form of TB. The statistical significance of differences in protein expression was determined by a nonparametric Mann-Whitney test. ns, not significant (P > 0.05). (F) Ratio of granzyme A-, perforin-, and granulysin-expressing cells to CD3 T-cell expression in the TB lesions and distal lung parenchyma. The mean values for paired expression of effector cells and CD3 T cells from patients with cavitary TB and noncavitary TB are shown.

Similar articles

Cited by

References

    1. Andersson, J., J. Abrams, L. Bjork, K. Funa, M. Litton, K. Agren, and U. Andersson. 1994. Concomitant in vivo production of 19 different cytokines in human tonsils. Immunology 83:16-24. - PMC - PubMed
    1. Andersson, J., H. Behbahani, J. Lieberman, E. Connick, A. Landay, B. Patterson, A. Sonnerborg, K. Lore, S. Uccini, and T. E. Fehniger. 1999. Perforin is not co-expressed with granzyme A within cytotoxic granules in CD8 T lymphocytes present in lymphoid tissue during chronic HIV infection. AIDS (London) 13:1295-1303. - PubMed
    1. Andersson, J., A. Boasso, J. Nilsson, R. Zhang, N. J. Shire, S. Lindback, G. M. Shearer, and C. A. Chougnet. 2005. The prevalence of regulatory T cells in lymphoid tissue is correlated with viral load in HIV-infected patients. J. Immunol. 174:3143-3147. - PubMed
    1. Andersson, J., S. Kinloch, A. Sonnerborg, J. Nilsson, T. E. Fehniger, A. L. Spetz, H. Behbahani, L. E. Goh, H. McDade, B. Gazzard, H. Stellbrink, D. Cooper, and L. Perrin. 2002. Low levels of perforin expression in CD8+ T lymphocyte granules in lymphoid tissue during acute human immunodeficiency virus type 1 infection. J. Infect. Dis. 185:1355-1358. - PubMed
    1. Betts, M. R., M. C. Nason, S. M. West, S. C. De Rosa, S. A. Migueles, J. Abraham, M. M. Lederman, J. M. Benito, P. A. Goepfert, M. Connors, M. Roederer, and R. A. Koup. 2006. HIV nonprogressors preferentially maintain highly functional HIV-specific CD8+ T cells. Blood 107:4781-4789. - PMC - PubMed

Publication types

MeSH terms