. 2007 Oct;27(19):6639-46.
doi: 10.1128/MCB.00798-07. Epub 2007 Jul 30.

Ribosomal slowdown mediates translational arrest during cellular division

Affiliations

Ribosomal slowdown mediates translational arrest during cellular division

Gilad Sivan et al. Mol Cell Biol. 2007 Oct.

Abstract

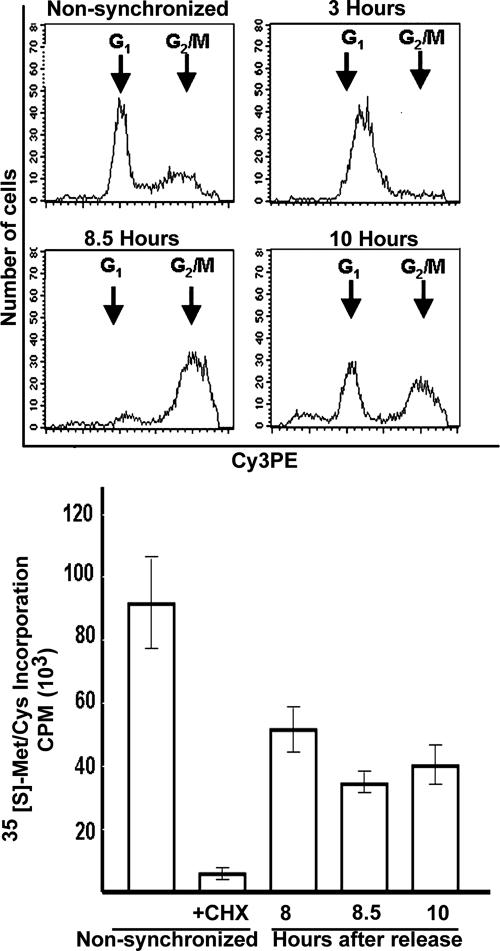
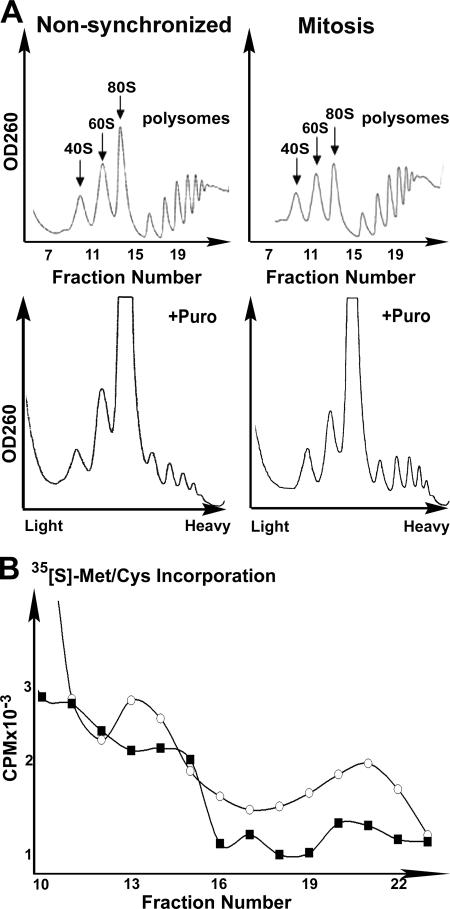
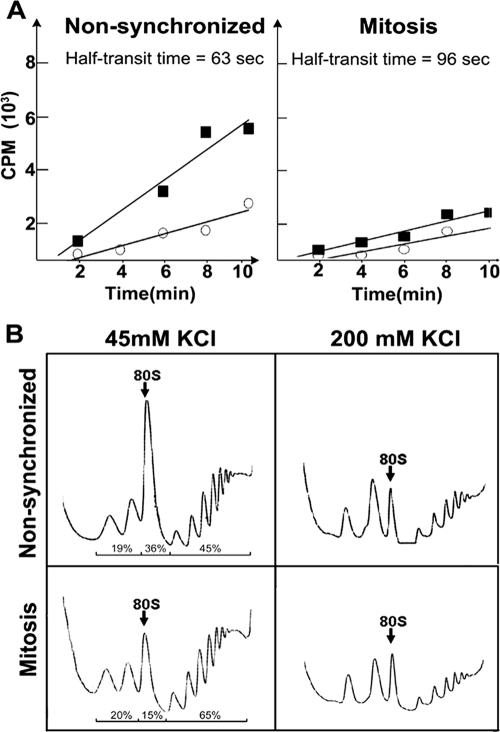
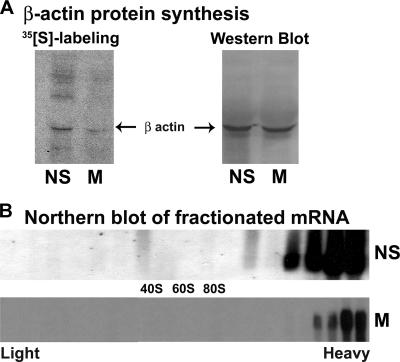
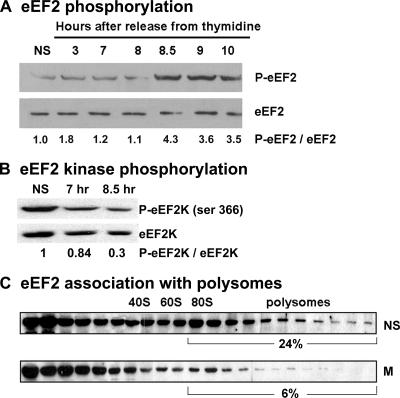
Global mRNA translation is transiently inhibited during cellular division. We demonstrate that mitotic cells contain heavy polysomes, but these are significantly less translationally active than polysomes in cycling cells. Several observations indicate that mitotic translational attenuation occurs during the elongation stage: (i) in cycling nonsynchronized cultures, only mitotic cells fail to assemble stress granules when treated with agents that inhibit translational initiation; (ii) mitotic cells contain fewer free 80S complexes, which are less sensitive to high salt disassembly; (iii) mitotic polysomes are more resistant to enforced disassembly using puromycin; and (iv) ribosome transit time increases during mitosis. Elongation slowdown guarantees that polysomes are retained even if initiation is inhibited at the same time. Stalling translating ribosomes during mitosis may protect mRNAs and allow rapid resumption of translation immediately upon entry into the G(1) phase.


Figures

FIG. 1.
FIG. 1.
Cells in mitosis do not contain SGs. U2OS cells in log-phase growth were unstressed (A and D), exposed to sodium arsenite for 1 h (B and E), or exposed to DMDA-pateamine A for 1 h (C and F) prior to fixation and staining for markers of PBs (green; DCP1a) and for SGs (red; eIF3). DNA is stained blue with Hoechst dye. Arrows indicate mitotic cells.
FIG. 2.
FIG. 2.
Protein synthesis is reduced during mitosis. HeLa cells were synchronized by a double thymidine block and released with fresh medium lacking thymidine for 3, 8.5, or 10 h. At the indicated time points, cell cycle analysis was performed by flow cytometry (upper panel), or the global protein synthesis rate was measured by [35S]methionine-cysteine incorporation during 10-min labeling (lower panel). For the CHX sample, the cells were treated with 100 μg/ml CHX at 30 min prior to labeling in the presence of CHX. The radioactivity at each time point is presented as the mean ± standard error of the mean of four independent measurements.
FIG. 3.
FIG. 3.
Translational arrest during mitosis is beyond the initiation stage. (A) Cycling nonsynchronized or mitotic (8.5 h after block release) HeLa cells were used for polysomal profile analysis before (upper panel) or after (lower panel) an additional 3-min incubation in the presence of 100 μg/μl of puromycin (+puro). The 40S, 60S, 80S, and polysomes peaks are indicated. (B) Cycling nonsynchronized (circles) or mitotic (squares) HeLa cells were labeled with 100 μCi/ml [35S]methionine-cysteine for the last 10 min prior to their harvest for the polysomal profile analysis presented in panel A. The counts per minute of fractions 10 to 23 as counted in a Beckman scintillation counter are shown. The data shown represent one of three independent similar experiments.
FIG. 4.
FIG. 4.
Increased ribosome half-transit time and increased resistance of 80S particles to 200 mM KCl. (A) The ribosome half-transit time was obtained as described in Materials and Methods. Incorporation of [35S]methionine-cysteine into total proteins (postmitochondrial supernatant; squares) or into completed peptides released from ribosomes (postribosomal supernatant; circles) is shown. The radioactivity at each time point is presented as a mean of three measurements. The transit time was determined from the displacement in time between the two lines, which were obtained by linear regression analysis. (B) Cycling nonsynchronized or mitotic (8.5 h after block release) HeLa cells were used for polysomal profile analysis in the presence of 45 mM (left) or 200 mM (right) KCl. The 80S peak is marked. The data shown represent one of three independent similar experiments.
FIG. 5.
FIG. 5.
β-Actin mRNA remains associated with heavy polysomes during mitosis despite its translation attenuation. (A) Cycling nonsynchronized (NS) or mitotic (8.5 h after block release; M) HeLa cells were labeled for 20 min with [35S]methionine-cysteine; β-actin was immunoprecipitated and resolved by sodium dodecyl sulfate-polyacrylamide gel electrophoresis and blotted onto a nitrocellulose membrane. The autoradiogram shows the labeled proteins (left). The same membrane was probed by Western blot analysis using antibody specific for β-actin (right). (B) Cycling nonsynchronized (NS) or mitotic (M) cells were used for polysomal analysis on sucrose gradients. Total RNA extracted from each of the 23 gradient fractions was subjected to Northern blot analysis using DIG-labeled probe specific for β-actin cDNA. The data shown represent one of three independent similar experiments.
FIG. 6.
FIG. 6.
eEF2 is phosphorylated during mitosis and dissociates from heavy polysomes. Equal amounts of total protein extracted from cycling nonsynchronized (NS) HeLa cells or cells that were released from a double thymidine block at the indicated times were subjected to immunoblot analysis using antibodies specific for phosphorylated eEF2 (p-eEF2) and for total eEF2 (A) or specific for eEF2K phosphorylated at Ser 366 [p-eEF2K(Ser366)] and for total eEF2K (B). Cycling nonsynchronized (NS) or mitotic (8.5 h after block release; M) cells were used for polysomal analysis. Total protein extracted from each of the 23 sucrose gradient fractions was subjected to immunoblot analysis using antibodies specific for eEF2 (C). The data shown represent one of two independent similar experiments. Band intensities were quantified by densitometry using ImageJ software.

Similar articles

Cited by

References

    1. Anderson, P., and N. Kedersha. 2002. Visibly stressed: the role of eIF2, TIA-1, and stress granules in protein translation. Cell Stress Chaperones 7:213-221. - PMC - PubMed
    1. Arava, Y., F. E. Boas, P. O. Brown, and D. Herschlag. 2005. Dissecting eukaryotic translation and its control by ribosome density mapping. Nucleic Acids Res. 33:2421-2432. - PMC - PubMed
    1. Blobel, G., and D. Sabatini. 1971. Dissociation of mammalian polyribosomes into subunits by puromycin. Proc. Natl. Acad. Sci. USA 68:390-394. - PMC - PubMed
    1. Bonneau, A. M., and N. Sonenberg. 1987. Involvement of the 24-kDa cap-binding protein in regulation of protein synthesis in mitosis. J. Biol. Chem. 262:11134-11139. - PubMed
    1. Bordeleau, M. E., R. Cencic, L. Lindqvist, M. Oberer, P. Northcote, G. Wagner, and J. Pelletier. 2006. RNA-mediated sequestration of the RNA helicase eIF4A by pateamine A inhibits translation initiation. Chem. Biol. 13:1287-1295. - PubMed

Publication types