. 2007 Aug 6;204(8):1999-2008.
doi: 10.1084/jem.20070304. Epub 2007 Jul 30.

Fibrin deposition accelerates neurovascular damage and neuroinflammation in mouse models of Alzheimer's disease

Affiliations

Fibrin deposition accelerates neurovascular damage and neuroinflammation in mouse models of Alzheimer's disease

Justin Paul et al. J Exp Med. .

Abstract

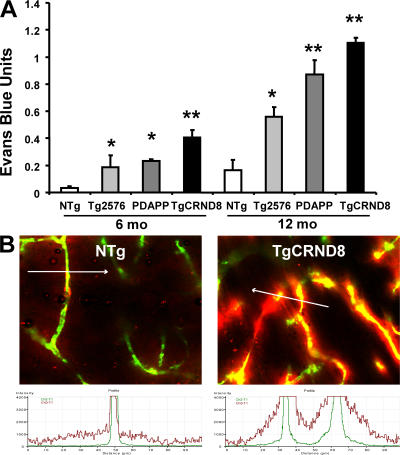
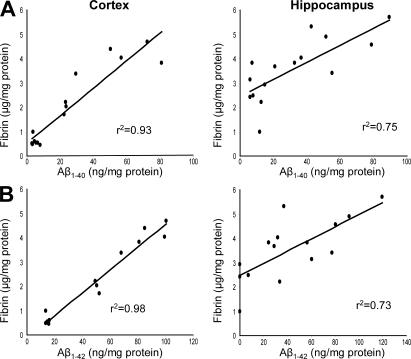
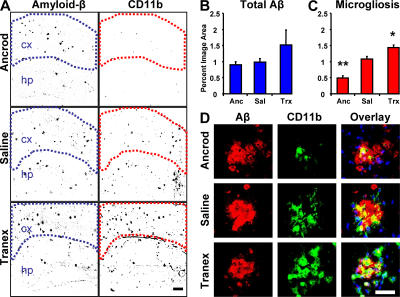
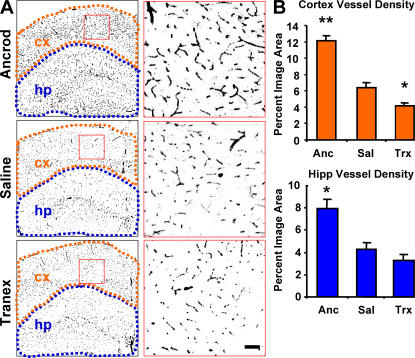
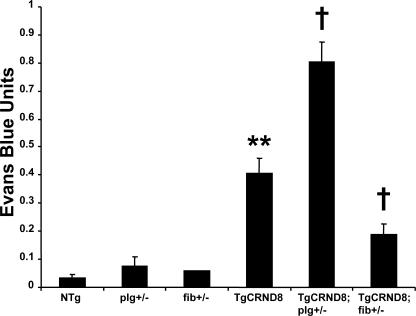
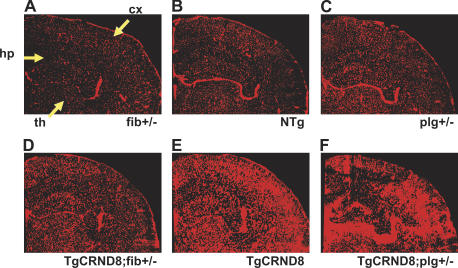
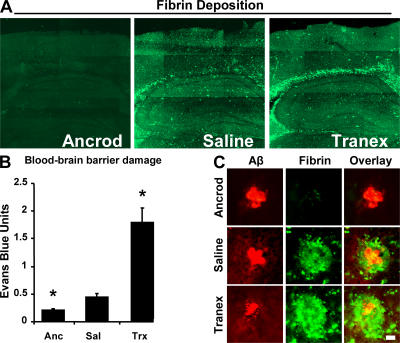
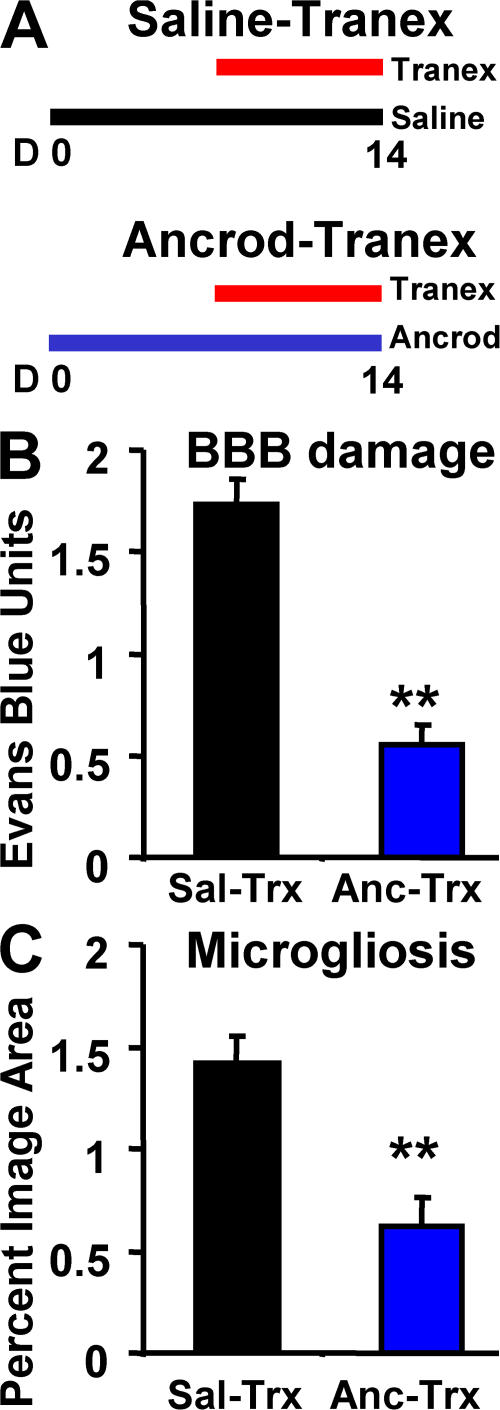
Cerebrovascular dysfunction contributes to the pathology and progression of Alzheimer's disease (AD), but the mechanisms are not completely understood. Using transgenic mouse models of AD (TgCRND8, PDAPP, and Tg2576), we evaluated blood-brain barrier damage and the role of fibrin and fibrinolysis in the progression of amyloid-beta pathology. These mouse models showed age-dependent fibrin deposition coincident with areas of blood-brain barrier permeability as demonstrated by Evans blue extravasation. Three lines of evidence suggest that fibrin contributes to the pathology. First, AD mice with only one functional plasminogen gene, and therefore with reduced fibrinolysis, have increased neurovascular damage relative to AD mice. Conversely, AD mice with only one functional fibrinogen gene have decreased blood-brain barrier damage. Second, treatment of AD mice with the plasmin inhibitor tranexamic acid aggravated pathology, whereas removal of fibrinogen from the circulation of AD mice with ancrod treatment attenuated measures of neuroinflammation and vascular pathology. Third, pretreatment with ancrod reduced the increased pathology from plasmin inhibition. These results suggest that fibrin is a mediator of inflammation and may impede the reparative process for neurovascular damage in AD. Fibrin and the mechanisms involved in its accumulation and clearance may present novel therapeutic targets in slowing the progression of AD.


Figures

Figure 1.
Figure 1.
Blood–brain barrier permeability and neurovascular damage is increased in three mouse models of AD. (A) Evans blue assay indicates increased blood–brain barrier permeability in the Tg2576, PDAPP, and TgCRND8 transgenic mice compared with nontransgenic (NTg) littermates. Data are given as Evans blue extravasation calculated from A620 of perfused brain homogenates and normalized to plasma Evans blue levels. For 6-mo mice, n = 9 for NTg (three each from Tg2576, PDAPP, and TgCRND8 litters), n = 3 for Tg2576, n = 6 for PDAPP, and n = 7 for TgCRND8; for 12-mo mice, n = 9 for NTg (three each from Tg2576, PDAPP, and TgCRND8 litters), n = 4 for Tg2576, n = 4 for PDAPP, and n = 4 for TgCRND8. Error bars represent the mean ± SEM. *, P < 0.05; **, P < 0.001, relative to nontransgenic littermates. (B) Laser-scanning micrograph of microvasculature in hippocampus of 6-mo TgCRND8 mouse and NTg littermate injected with Evans blue (red) 6 h before and perfused at the time of killing with 2,000-kD dextran (green). Fluorescence intensity across a cross section (indicated by white arrow; 100 μm) of a capillary is scanned for the distribution of each fluorochrome.
Figure 2.
Figure 2.
Fibrinogen accumulates through the damaged neurovasculature. (A) Fibrin deposition parallels age-dependent Aβ accumulation. TgCRND8 cortex and hippocampus were isolated, and homogenates were assayed each for fibrinogen and Aβ1-40 by ELISA. Each point represents one TgCRND8 mouse. Correlation coefficients are indicated. (B) The same cortex and hippocampus homogenates were assayed each for fibrinogen and Aβ1-42 by ELISA.
Figure 3.
Figure 3.
Fibrinogen depletion and inhibition of fibrinolysis in the 6-mo TgCRND8 mouse have opposite effects on neuroinflammation. (A) Representative immunofluorescent images of brains colabeled for Aβ (left) and CD11b, a marker for activated microglia (right). Regions of interest are outlined to demark the cortical region quantified in each image. Images show increased density of inflammatory foci in the cortex of plasmin-inhibited transgenic mice, whereas fibrinogen-depleted transgenics show decreased density relative to age-matched saline-treated TgCRND8 mice. Bar, 200 μm. (B) Analysis of total Aβ staining within marked regions of interest in the cortex; the differences were not significant (P > 0.05). (C) Analysis of CD11b staining shows increased inflammation density in the cortex of plasmin-inhibited transgenic mice, whereas fibrinogen-depleted transgenics show a decrease. Error bars present the mean ± SEM of four images for each of five ancrod-, four tranex-, and two saline-treated mice. *, P < 0.05; **, P < 0.001, relative to saline-treated mice. (D) High-magnification images of microglia (green) and Aβ plaques (red) in each treatment group. Bar, 50 μm.
Figure 4.
Figure 4.
Fibrinogen depletion and inhibition of fibrinolysis in the TgCRND8 mouse have opposite effects on neurovascular damage. (A) Neurovasculature in ancrod-, saline-, and tranexamic acid–treated TgCRND8 mice. Images of brains labeled for PECAM-1 (black) are shown with higher magnification images of the regions shown in red to the right. Regions defining cortex (orange) and hippocampus (blue) were used for quantification of vascular density. The images show decreased vascular density in the cortex (cx) and hippocampus (hp) of plasmin-inhibited transgenic mice, whereas fibrinogen-depleted transgenics show increased vascular density over age-matched saline-treated TgCRND8 mice at 6 mo. (B) Semiquantitative analysis of PECAM-1 staining in the cortex and hippocampus shows decreased vascular density in plasmin-inhibited transgenic mice, whereas fibrinogen-depleted transgenics show an increase. Bars represent the percentage of image area reported as the mean ± SEM of four images of the cortex and hippocampus of four mice in each treatment group. *, P < 0.05; **, P < 0.001, relative to saline-treated mice.
Figure 5.
Figure 5.
Genetic plasminogen and fibrinogen deficiency modulate defects in the AD mouse blood–brain barrier. 6-mo-old AD mice deficient for plasminogen (TgCRND8;plg+/−) and fibrinogen (TgCRND8;fib+/−) were assayed for Evans blue extravasation alongside TgCRND8 littermates. TgCRND8;plg+/− mice showed increased blood–brain barrier permeability, whereas TgCRND8;fib+/− mice showed a decrease. Data are given as Evans blue extravasation calculated from A620 of perfused brain homogenates and normalized to plasma Evans blue levels. n = 8 for NTg; n = 8 for TgCRND8; and n = 3 for TgCRND8;plg+/−, TgCRND8;fib+/−, fib+/−, and plg+/− mice. Bars represent the mean ± SEM. **, P < 0.001, relative to nontransgenics; , P < 0.05, relative to TgCRND8.
Figure 6.
Figure 6.
Localization of vascular pathology in AD mice deficient for fibrinogen or fibrinolysis. (A–F) Composite images of cerebral hemispheres of 6-mo-old mice perfused with Evans blue for 6 h. TgCRND8;fib+/− (D) and TgCRND8;plg+/− (F) mice are compared with TgCRND8 mice (E) and fib+/− (A), NTg (B), and plg+/− (C) controls. Pathologic dye accumulation is most apparent in the cortex (cx), hippocampus (hp), and thalamus (th).
Figure 7.
Figure 7.
Fibrin deposition and vascular damage are modified by manipulation of fibrinogen levels and fibrinolysis. (A) Representative images of perfused brains from each treatment group stained for fibrin. Images were tiled together using a motorized stage on a confocal microscope. (B) Evans blue extravasation from ancrod-, saline-, and tranexamic acid–treated 6-mo TgCRND8 mice. Data are represented as mean ± SEM of each treatment group, where n = 3 for each group. *, P < 0.05, relative to saline-treated mice. Fibrinogen depletion with ancrod reduces vascular damage, whereas plasmin inhibition enhances permeability. (C) High-magnification images of fibrin deposition (green) with Aβ plaques (red). Bar, 20 μm.
Figure 8.
Figure 8.
Ancrod treatment protects AD mice from increased pathology induced by tranexamic acid. (A) Two groups of 6-mo TgCRND8 mice were treated as indicated. (B) Evans blue extravasation. (C) Analysis of CD11b staining. In both cases, pretreatment with ancrod reduced the effect of tranexamic acid. Error bars present the mean ± SEM of four images for each of four ancrod- and four saline-treated mice. **, P < 0.001.

Similar articles

Cited by

References

    1. Hardy, J., and D.J. Selkoe. 2002. The amyloid hypothesis of Alzheimer's disease: progress and problems on the road to therapeutics. Science. 297:353–356. - PubMed
    1. de la Torre, J.C. 2004. Is Alzheimer's disease a neurodegenerative or a vascular disorder? Data, dogma, and dialectics. Lancet Neurol. 3:184–190. - PubMed
    1. Farkas, E., and P.G. Luiten. 2001. Cerebral microvascular pathology in aging and Alzheimer's disease. Prog. Neurobiol. 64:575–611. - PubMed
    1. Vinters, H.V., Z.Z. Wang, and D.L. Secor. 1996. Brain parenchymal and microvascular amyloid in Alzheimer's disease. Brain Pathol. 6:179–195. - PubMed
    1. Fiala, M., Q.N. Liu, J. Sayre, V. Pop, V. Brahmandam, M.C. Graves, and H.V. Vinters. 2002. Cyclooxygenase-2-positive macrophages infiltrate the Alzheimer's disease brain and damage the blood-brain barrier. Eur. J. Clin. Invest. 32:360–371. - PubMed

Publication types