

Naive CD8+ T cells differentiate into protective memory-like cells after IL-2 anti IL-2 complex treatment in vivo
- PMID: 17664293
- PMCID: PMC2118678
- DOI: 10.1084/jem.20070543
Naive CD8+ T cells differentiate into protective memory-like cells after IL-2 anti IL-2 complex treatment in vivo
Abstract
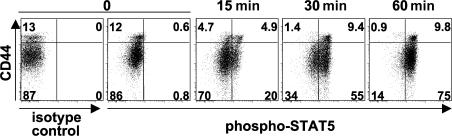
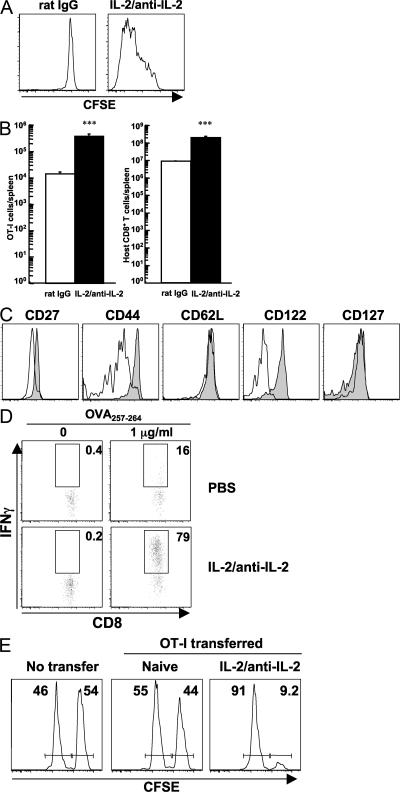
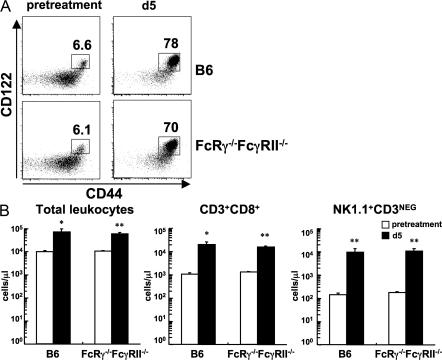
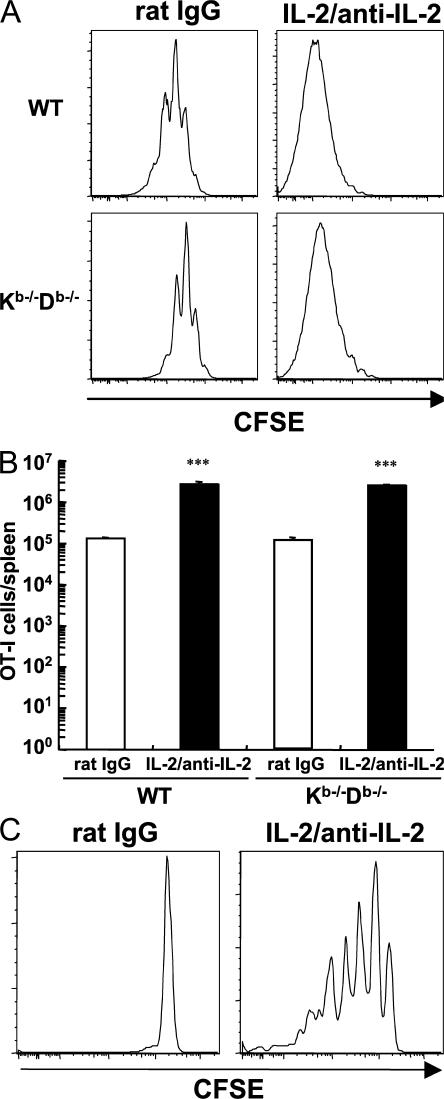
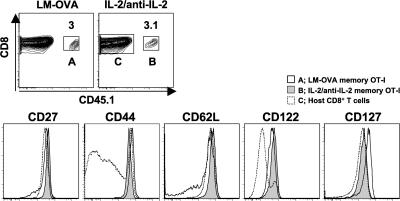
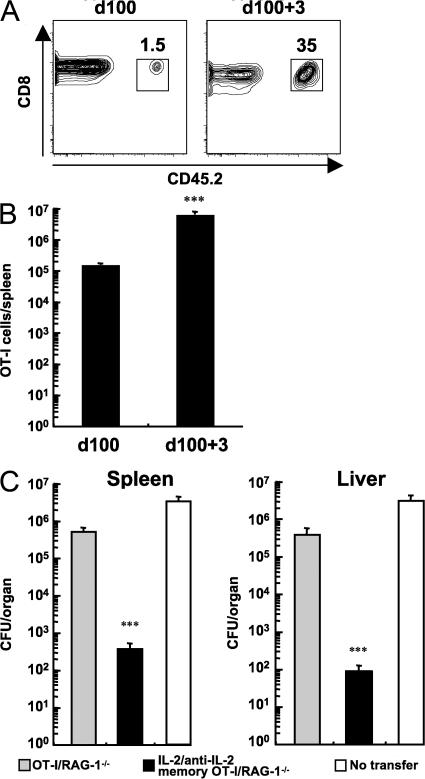
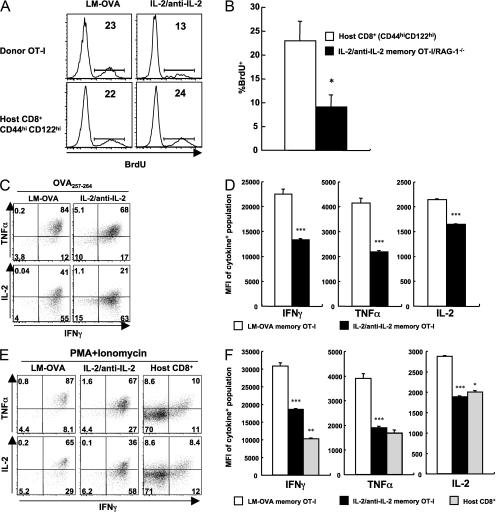
An optimal CD8(+) T cell response requires signals from the T cell receptor (TCR), co-stimulatory molecules, and cytokines. In most cases, the relative contribution of these signals to CD8(+) T cell proliferation, accumulation, effector function, and differentiation to memory is unknown. Recent work (Boyman, O., M. Kovar, M.P. Rubinstein, C.D. Surh, and J. Sprent. 2006. Science. 311:1924-1927; Kamimura, D., Y. Sawa, M. Sato, E. Agung, T. Hirano, and M. Murakami. 2006. J. Immunol. 177:306-314) has shown that anti-interleukin (IL) 2 monoclonal antibodies that are neutralizing in vitro enhance the potency of IL-2 in vivo. We investigated the role of IL-2 signals in driving CD8(+) T cell proliferation in the absence of TCR stimulation by foreign antigen. IL-2 signals induced rapid activation of signal transducer and activator of transcription 5 in all CD8(+) T cells, both naive and memory phenotype, and promoted the differentiation of naive CD8(+) T cells into effector cells. IL-2-anti-IL-2 complexes induced proliferation of naive CD8(+) T cells in an environment with limited access to self-major histocompatibility complex (MHC) and when competition for self-MHC ligands was severe. After transfer into wild-type animals, IL-2-activated CD8(+) T cells attained and maintained a central memory phenotype and protected against lethal bacterial infection. IL-2-anti-IL-2 complex-driven memory-like CD8(+) T cells had incomplete cellular fitness compared with antigen-driven memory cells regarding homeostatic turnover and cytokine production. These results suggest that intense IL-2 signals, with limited contribution from the TCR, program the differentiation of protective memory-like CD8(+) cells but are insufficient to guarantee overall cellular fitness.
Figures
Similar articles
-
An intense form of homeostatic proliferation of naive CD8+ cells driven by IL-2.J Exp Med. 2007 Aug 6;204(8):1787-801. doi: 10.1084/jem.20070740. Epub 2007 Jul 30. J Exp Med. 2007. PMID: 17664294 Free PMC article.
-
STAT5-mediated signals sustain a TCR-initiated gene expression program toward differentiation of CD8 T cell effectors.J Immunol. 2006 Apr 15;176(8):4834-42. doi: 10.4049/jimmunol.176.8.4834. J Immunol. 2006. PMID: 16585578
-
IL-15 mimics T cell receptor crosslinking in the induction of cellular proliferation, gene expression, and cytotoxicity in CD8+ memory T cells.Proc Natl Acad Sci U S A. 2002 Apr 30;99(9):6192-7. doi: 10.1073/pnas.092675799. Epub 2002 Apr 23. Proc Natl Acad Sci U S A. 2002. PMID: 11972069 Free PMC article.
-
IL-15 is a growth factor and an activator of CD8 memory T cells.Ann N Y Acad Sci. 2002 Dec;975:46-56. doi: 10.1111/j.1749-6632.2002.tb05940.x. Ann N Y Acad Sci. 2002. PMID: 12538153 Review.
-
Cytokine synergy in antigen-independent activation and priming of naive CD8+ T lymphocytes.Crit Rev Immunol. 2009;29(3):219-39. doi: 10.1615/critrevimmunol.v29.i3.30. Crit Rev Immunol. 2009. PMID: 19538136 Review.
Cited by
-
Low-affinity TCR engagement drives IL-2-dependent post-thymic maintenance of naive CD4+ T cells in aged humans.Aging Cell. 2015 Oct;14(5):744-53. doi: 10.1111/acel.12353. Epub 2015 May 25. Aging Cell. 2015. PMID: 26010129 Free PMC article.
-
mTOR Complex Signaling through the SEMA4A-Plexin B2 Axis Is Required for Optimal Activation and Differentiation of CD8+ T Cells.J Immunol. 2015 Aug 1;195(3):934-43. doi: 10.4049/jimmunol.1403038. Epub 2015 Jun 26. J Immunol. 2015. PMID: 26116513 Free PMC article.
-
Dynamics and genomic landscape of CD8+ T cells undergoing hepatic priming.Nature. 2019 Oct;574(7777):200-205. doi: 10.1038/s41586-019-1620-6. Epub 2019 Oct 2. Nature. 2019. PMID: 31582858 Free PMC article.
-
Impact of patient characteristics on innate immune responses and inflammasome activation in ex vivo human lung tissues infected with influenza A virus.Front Cell Infect Microbiol. 2023 Oct 13;13:1269329. doi: 10.3389/fcimb.2023.1269329. eCollection 2023. Front Cell Infect Microbiol. 2023. PMID: 37900310 Free PMC article.
-
Activation of insulin-reactive CD8 T-cells for development of autoimmune diabetes.Diabetes. 2009 May;58(5):1156-64. doi: 10.2337/db08-0800. Epub 2009 Feb 10. Diabetes. 2009. PMID: 19208910 Free PMC article.
References
-
- Haring, J.S., V.P. Badovinac, and J.T. Harty. 2006. Inflaming the CD8+ T cell response. Immunity. 25:19–29. - PubMed
-
- Williams, M.A., and M.J. Bevan. 2007. Effector and memory CTL differentiation. Annu. Rev. Immunol. 25:171–192. - PubMed
-
- Lin, J.X., and W.J. Leonard. 2000. The role of Stat5a and Stat5b in signaling by IL-2 family cytokines. Oncogene. 19:2566–2576. - PubMed
-
- Malek, T.R., and A.L. Bayer. 2004. Tolerance, not immunity, crucially depends on IL-2. Nat. Rev. Immunol. 4:665–674. - PubMed
-
- Sakaguchi, S., M. Ono, R. Setoguchi, H. Yagi, S. Hori, Z. Fehervari, J. Shimizu, T. Takahashi, and T. Nomura. 2006. Foxp3+ CD25+ CD4+ natural regulatory T cells in dominant self-tolerance and autoimmune disease. Immunol. Rev. 212:8–27. - PubMed
Publication types
MeSH terms
Substances
Grants and funding
LinkOut - more resources
Full Text Sources
Other Literature Sources
Research Materials
