. 2007 Aug 6;204(8):1787-801.
doi: 10.1084/jem.20070740. Epub 2007 Jul 30.

An intense form of homeostatic proliferation of naive CD8+ cells driven by IL-2

Affiliations

An intense form of homeostatic proliferation of naive CD8+ cells driven by IL-2

Jae-Ho Cho et al. J Exp Med. .

Abstract

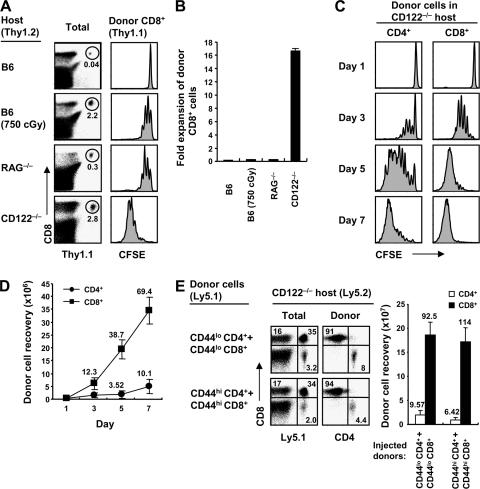
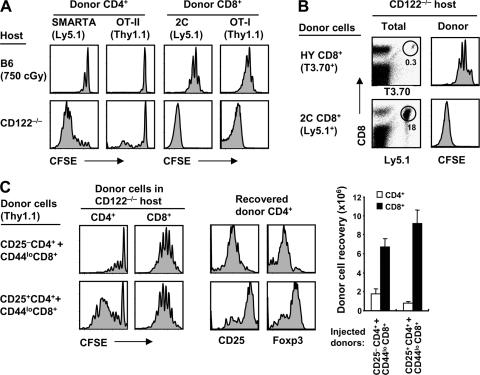
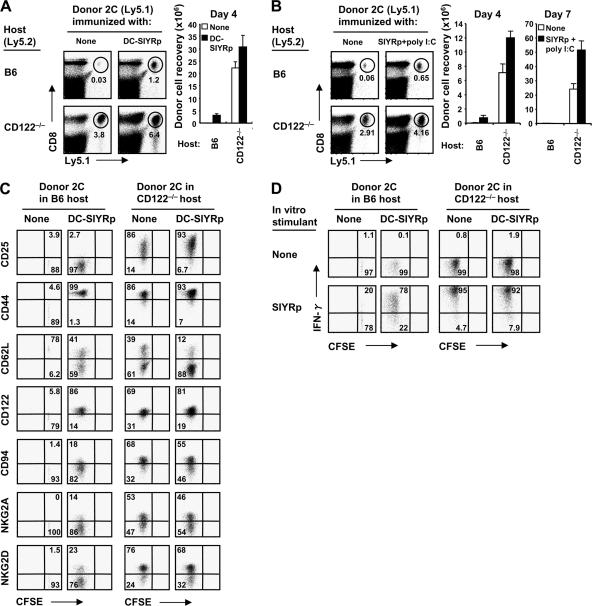
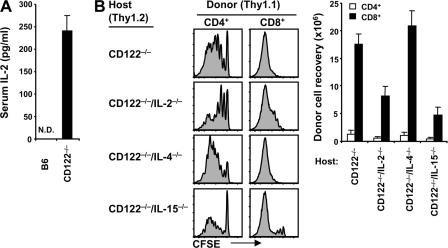
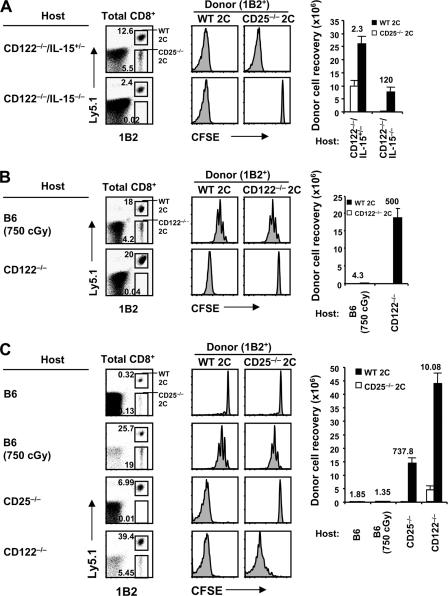
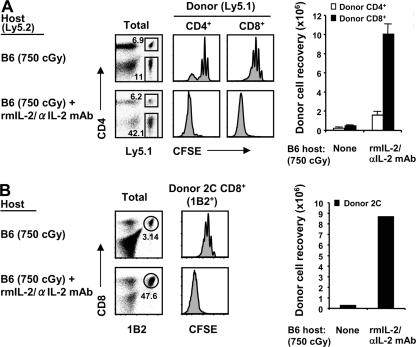
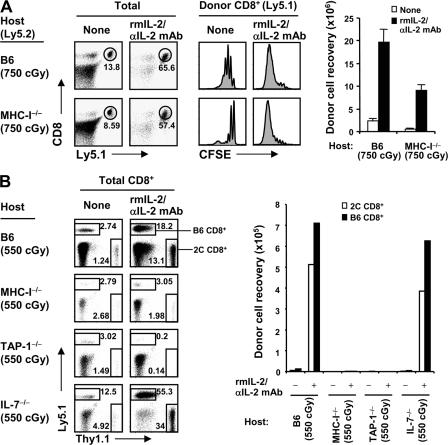
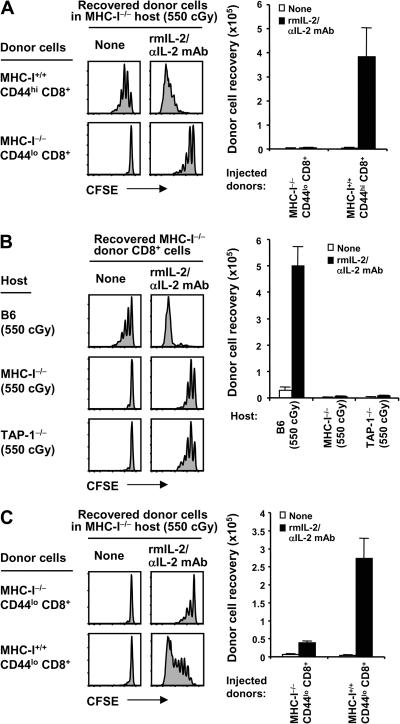
In conditions of T lymphopenia, interleukin (IL) 7 levels rise and, via T cell receptor for antigen-self-major histocompatibility complex (MHC) interaction, induce residual naive T cells to proliferate. This pattern of lymphopenia-induced "homeostatic" proliferation is typically quite slow and causes a gradual increase in total T cell numbers and differentiation into cells with features of memory cells. In contrast, we describe a novel form of homeostatic proliferation that occurs when naive T cells encounter raised levels of IL-2 and IL-15 in vivo. In this situation, CD8(+) T cells undergo massive expansion and rapid differentiation into effector cells, thus closely resembling the T cell response to foreign antigens. However, the responses induced by IL-2/IL-15 are not seen in MHC-deficient hosts, implying that the responses are driven by self-ligands. Hence, homeostatic proliferation of naive T cells can be either slow or fast, with the quality of the response to self being dictated by the particular cytokine (IL-7 vs. IL-2/IL-15) concerned. The relevance of the data to the gradual transition of naive T cells into memory-phenotype (MP) cells with age is discussed.


Figures

Figure 1.
Figure 1.
Proliferation of normal T cells in CD122−/− hosts. (A) FACS-sorted naive (CD44lo) CD8+ T cells (Thy1.1) were CFSE labeled and transferred i.v. at 106 cells per mouse into normal B6, irradiated (750 cGy) B6, RAG−/−, and CD122−/− mice. Spleen and LN cells were analyzed 4 d later by flow cytometry after staining for Thy1.1 and CD8 (left). Numbers in the dot plot indicate percentages of donor CD8+ (Thy1.1+ CD8+) cells within the total lymphocyte populations. CFSE profiles show the proliferation of gated donor CD8+ cells from the indicated hosts (right). (B) Fold expansion of donor cells recovered from pooled spleen and LN of mice in A (mean ± SD of two mice per group). (C) A mixture of FACS-sorted CD44lo CD4+ and CD8+ cells (Thy1.1) was CFSE labeled and transferred into CD122−/− mice (0.5 × 10⁶ cells of each population per mouse). At the indicated time points, spleen and LN cells were analyzed by flow cytometry. Shown are CFSE profiles of gated donor CD4+ (Thy1.1+ CD8) and CD8+ (Thy1.1+ CD8+) cells. (D) Total donor cell recoveries from mice in C (mean ± SD of two to three mice at each time point). Numbers indicate fold expansion of donor cells at each time point. (E) Mixtures of FACS-sorted CD44lo or CD44hi CD4+ and CD8+ cells (Ly5.1) were transferred into CD122−/− mice (2 × 10⁶ cells of each population per mouse). Spleen and LN cells were analyzed 7 d later by flow cytometry. Dot plots show Ly5.1 versus CD8 profiles (left) of total lymphocytes and CD4 versus CD8 profiles (right) of gated donor (Ly5.1+) CD44lo (top) and CD44hi cells (bottom), and the bar graph shows total donor cell recoveries from the indicated hosts (mean ± SD of two mice per group). Numbers in the dot plots and bar graph indicate percentages of cells in the quadrants and the fold expansion of recovered donor cells, respectively.
Figure 2.
Figure 2.
Proliferation of TCR Tg T cells in CD122−/− mice and the influence of T reg cells. (A) Mixtures of FACS-sorted CD44lo SMARTA (Ly5.1) and OT-II (Thy1.1) CD4+ cells or CD44lo 2C (Ly5.1) and OT-I (Thy1.1) CD8+ cells were CFSE labeled and transferred into irradiated (750 cGy) B6 (top) and CD122−/− (bottom) mice (0.5–1 × 10⁶ cells of each population per mouse). Spleen and LN cells were analyzed 7 d later by flow cytometry. Shown are CFSE profiles of gated donor SMARTA (Ly5.1+ Thy1.1) and OT-II (Ly5.1 Thy1.1+) CD4 cells or donor 2C (Ly5.1+ Thy1.1) and OT-I (Ly5.1 Thy1.1+) CD8+ cells. (B) FACS-sorted CD44lo HY (T3.70) or 2C (Ly5.1) CD8+ cells were CFSE labeled and transferred into CD122−/− mice (0.4–1 × 10⁶ cells per mouse). Spleen and LN cells were analyzed 7 d later by flow cytometry. Shown are T3.70 versus CD8 profiles (top) or Ly5.1 versus CD8 profiles (bottom) of total lymphocytes (left) and CFSE profiles of gated donor HY (T3.70+ CD8+) and 2C (Ly5.1+ CD8+) cells (right). Numbers in the dot plots indicate percentages of cells in the gates. (C) Using normal B6 mice as donors, 0.5 × 10⁶ FACS-sorted CFSE-labeled CD44lo CD8+ cells (Thy1.1) were cotransferred with either 106 CFSE-labeled CD25 CD4+ (top) or CD25+ CD4+ (T reg) cells (bottom) into CD122−/− mice. Spleen and LN cells were analyzed 3 d later by flow cytometry. Histograms show CFSE profiles (left) of gated donor CD4+ (Thy1.1+ CD8; left) and CD8+ (Thy1.1+ CD8+; right) cells and expression of CD25 and Foxp3 (middle) on gated donor CD25 CD4+ (top) and CD25+ CD4+ cells (bottom). Bar graph shows total donor cell recoveries from the indicated hosts (mean ± SD of two mice per group).
Figure 3.
Figure 3.
Comparison with responses to foreign antigens. 106 MACS-purified CFSE-labeled (A) or 0.5 × 10⁶ FACS-sorted unlabeled (B) CD44lo 2C cells (Ly5.1) were transferred into normal B6 (top) and CD122−/− (bottom) mice and were either unimmunized (left) or immunized (right) with either 2 × 10⁶ BM-derived DCs pulsed with SIYRp (DC-SIYRp; A) or with soluble SIYRp plus poly I:C (B), as described in Materials and methods. Spleen and LN cells were analyzed on day 4 (A) and days 4 and 7 (B) by flow cytometry. Dot plots in A and B show Ly5.1 versus CD8 profiles of total lymphocytes on day 4 in the indicated hosts, and numbers in the plots indicate percentages of cells in the gates. Bar graphs show total recoveries of donor 2C (Ly5.1+ CD8+) cells on day 4 (A) and days 4 and 7 (B) from the indicated hosts (mean ± SD of two to three mice per group). (C and D) Expression of various surface markers (C) and intracellular staining of IFN-γ production (D) on gated donor 2C cells from B6 (left) versus CD122−/− (right) mice shown in A. IFN-γ production was measured by 5-h in vitro stimulation without (top) or with (bottom) SIYRp, as described in Materials and methods. Numbers in the dot plots indicate percentages of cells in the quadrants.
Figure 4.
Figure 4.
Cytokines as a stimulus in CD122−/− mice. (A) Serum IL-2 protein levels were tested from normal B6 versus CD122−/− mice by ELISA, as described in Materials and methods. Means ± SD of three to five mice per group are shown. N.D., not detected. (B) A mixture of FACS-sorted CD44lo CD4+ and CD8+ cells (Thy1.1) was CFSE labeled and transferred into CD122−/−, CD122−/−/IL-2−/−, CD122−/−/IL-4−/−, and CD122−/−/IL-15−/− mice (106 cells of each subset per mouse). Spleen and LN cells were analyzed 4 d later by flow cytometry. Shown are CFSE profiles (left) of gated donor CD4+ (Thy1.1+ CD8; left) and CD8+ (Thy1.1+ CD8+; right) cells and total donor cell recoveries from the indicated hosts (bar graph; mean ± SD of two to three mice per group).
Figure 5.
Figure 5.
Contribution of IL-2 and IL-15 as stimuli in CD122−/− mice. (A) A mixture of FACS-sorted CD44lo WT 2C (Ly5.1, 1B2+) and CD25−/− 2C (Ly5.2, 1B2+) CD8+ cells was CFSE labeled and transferred into CD122−/−/IL-15+/− (top) and CD122−/−/IL-15−/− (bottom) mice (0.5 × 10⁶ cells of each population per mouse). Spleen and LN cells were analyzed 5 d later by flow cytometry. Shown are Ly5.1 and 1B2 profiles (left) of gated total CD8+ cells, CFSE profiles (middle) of gated donor WT (1B2+ Ly5.1+; left) versus CD25−/− (1B2+ Ly5.1; right) 2C CD8+ cells, and total donor cell recoveries from the indicated hosts (bar graph; mean ± SD of two mice per group). (B) A mixture of FACS-sorted CD44lo WT (Ly5.1) and CD122−/− 2C CD8+ cells (Ly5.2) was CFSE labeled and transferred into irradiated (750 cGy) B6 (top) and CD122−/− (bottom) mice (0.5 × 10⁶ cells of each population per mouse). Spleen and LN cells were analyzed 5 d later by flow cytometry. Shown are Ly5.1 and 1B2 profiles (left) of gated total CD8+ cells, CFSE profiles (middle) of gated donor WT (left) versus CD122−/− 2C CD8+ (right) cells, and total donor cell recoveries from the indicated hosts (bar graph; mean ± SD of two to three mice per group). (C) A mixture of FACS-sorted CD44lo WT (Ly5.1) and CD25−/− 2C CD8+ cells (Ly5.2) was CFSE labeled and transferred into normal B6, irradiated (750 cGy) B6, CD25−/−, and CD122−/− mice (0.5 × 10⁶ cells of each population per mouse). Spleen and LN cells were analyzed 7 d later by flow cytometry. Shown are Ly5.1 and 1B2 profiles (left) of gated total CD8+ cells, CFSE profiles (middle) of gated donor WT (left) versus CD25−/− 2C CD8+ (right) cells, and total donor cell recoveries from the indicated hosts (bar graph; mean ± SD of two to three mice per group). Numbers in the dot plots and bar graph indicate percentages of cells in the gates and the ratio of WT to either CD25−/− (A and C) or CD122−/− (B) 2C CD8+ cells recovered.
Figure 6.
Figure 6.
Proliferation of naive T cells in response to IL-2–IL-2 mAb complexes. (A) A mixture of FACS-sorted CD44lo CD4+ and CD8+ cells (Ly5.1) was CFSE labeled and transferred into irradiated (750 cGy) B6 mice (1.5 × 10⁶ cells of each subset per mouse). Host mice were either uninjected (top) or injected i.p. (bottom) daily for four consecutive days with IL-2–IL-2 mAb complexes, as described in Materials and methods. Spleen and LN cells were analyzed 1 d later (on day 5) by flow cytometry. Shown are Ly5.1 versus CD4 profiles (left) of total lymphocytes, CFSE profiles (middle) of gated donor CD4+ (Ly5.1+ CD4+; left) and CD8+ (Ly5.1+ CD4; right) cells, and total donor cell recoveries from the indicated hosts (bar graph; mean ± SD of three mice per group). (B) 1–1.5 × 10⁶ MACS-purified CFSE-labeled CD44lo 2C CD8+ cells (1B2+) were transferred into irradiated (750 cGy) B6 mice. Host mice were either untreated (top) or treated (bottom) with IL-2–IL-2 mAb complexes, as in A. Spleen and LN cells were analyzed on day 5 by flow cyto metry. Shown are 1B2 versus CD8 profiles (left) of total lymphocytes, CFSE profiles (middle) of gated donor 2C (1B2+ CD8+) cells, and total donor cell recoveries from the indicated hosts (bar graph; one representative of at least three independent experiments). Numbers in the dot plots indicate percentages of cells in the gates.
Figure 7.
Figure 7.
MHC-I requirement for IL-2–IL-2 mAb–driven proliferation. (A) FACS-sorted CD44lo CD8+ cells (Ly5.1) were CFSE labeled and transferred into irradiated (750 cGy) B6 (top) and MHC-I−/− (bottom) mice (2.5–3 × 10⁶ cells per mouse). Host mice were either uninjected or injected with IL-2–IL-2 mAb complexes, as in Fig. 6. Spleen and LN cells were analyzed on day 5 by flow cytometry. Shown are Ly5.1 versus CD8 profiles (left) of total lymphocytes, CFSE profiles (middle) of gated donor CD8+ (Ly5.1+ CD8+) cells, and total donor cell recoveries from the indicated hosts (bar graph; mean ± SD of two mice per group). (B) A mixture of FACS-sorted CD44lo B6 (Ly5.1) and 2C CD8+ cells (Thy1.1) was transferred into various irradiated (550 cGy) B6, MHC-I−/−, TAP-1−/−, and IL-7−/− mice (105 cells of each population per mouse), followed either by no treatment or injection of IL-2–IL-2 mAb complexes, as in Fig. 6. Spleen and LN cells were analyzed on day 7 by flow cytometry. Shown are Thy1.1 versus Ly5.1 profiles (left) of total CD8+ cells and total recoveries of donor B6 (Ly5.1+ Thy1.1) and 2C (Ly5.1 Thy1.1+) CD8+ cells from the indicated hosts (bar graph; one representative of two independent experiments). Numbers in the dot plots indicate percentages of cells in the gates.
Figure 8.
Figure 8.
Response of MHC-I−/− CD8+ cells to IL-2–IL-2 mAb in MHC-I−/− hosts. (A) MHC-I+/+ CD44hi (Ly5.1; top) or MHC-I−/− CD44lo (Thy1.2; bottom) CD8+ cells were purified by FACS sorting from normal B6.SJL and MHC-I−/− BM→B6 chimeras, as described in Materials and methods, respectively, and transferred into irradiated (550 cGy) MHC-I−/− mice (2 × 10⁵ cells per mouse). Host mice were either uninjected or injected with IL-2–IL-2 mAb complexes, as in Fig. 6. Spleen and LN cells were analyzed on day 5 by flow cytometry. Shown are CFSE profiles (left) of gated donor MHC-I+/+ CD44hi CD8+ (Ly5.1+ Kb+ Db+ CD8+; top) and MHC-I−/− CD44lo CD8+ (Thy1.2+ CFSE+ Kb− Db− CD8+; bottom) cells and total donor cell recoveries from the indicated hosts (bar graph; mean ± SD of two mice per group). (B) FACS-sorted MHC-I−/− CD44lo CD8+ cells were obtained as in A, CFSE labeled, transferred into irradiated (550 cGy) B6.PL (Thy1.1; top), MHC-I−/− (middle), and TAP-1−/− mice (bottom; 2 × 10⁵ cells per mouse), and followed either by no treatment or injection of IL-2–IL-2 mAb complexes, as in Fig. 6. Host mice were also treated with anti-NK1.1 mAb (days −1, 0, 2, and 4), as described in Materials and methods. Spleen and LN cells were analyzed on day 5 by flow cytometry. Shown are CFSE profiles (left) of gated donor MHC-I−/− CD44lo CD8+ cells (Thy1.2+ Kb− Db− CD8+ for B6.PL hosts; Thy1.2+ CFSE+ Kb− Db− CD8+ for both MHC-I−/− and TAP-1−/− hosts) and total donor cell recoveries (bar graph; mean ± SD of two mice per group). (C) MHC-I−/− CD44lo (Thy1.2; top) or MHC-I+/+ CD44lo (Ly5.1; bottom) CD8+ cells were purified by FACS sorting from MHC-I−/− BM→B6 chimeras and normal B6.SJL mice, respectively, and transferred into irradiated (550 cGy) MHC-I−/− mice (2 × 10⁶ cells per mouse). Host mice were either uninjected or injected with IL-2–L-2 mAb complexes, as in Fig. 6. Spleen and LN cells were analyzed on day 5 by flow cytometry. Shown are CFSE profiles (left) of gated donor MHC-I+/+ CD44lo CD8+ (Ly5.1+ Kb+ Db+ CD8+; bottom) and MHC-I−/− CD44lo CD8+ (Thy1.2+ CFSE+ Kb− Db− CD8+; top) cells and total donor cell recoveries from the indicated hosts (bar graph; mean ± SD of two mice per group).

Similar articles

Cited by

References

    1. Sprent, J. 1993. Lifespans of naive, memory and effector lymphocytes. Curr. Opin. Immunol. 5:433–438. - PubMed
    1. Freitas, A.A., and B.B. Rocha. 1993. Lymphocyte lifespans: homeostasis, selection and competition. Immunol. Today. 14:25–29. - PubMed
    1. Tough, D.F., and J. Sprent. 1994. Turnover of naive- and memory-phenotype T cells. J. Exp. Med. 179:1127–1135. - PMC - PubMed
    1. Tanchot, C., F.A. Lemonnier, B. Perarnau, A.A. Freitas, and B. Rocha. 1997. Differential requirements for survival and proliferation of CD8 naive or memory T cells. Science. 276:2057–2062. - PubMed
    1. Kirberg, J., A. Berns, and H. von Boehmer. 1997. Peripheral T cell survival requires continual ligation of the T cell receptor to major histocompatibility complex–encoded molecules. J. Exp. Med. 186:1269–1275. - PMC - PubMed

Publication types