. 2007 Aug;130(2):133-44.
doi: 10.1085/jgp.200609575.

Intracellular Ca2+ oscillations, a potential pacemaking mechanism in early embryonic heart cells

Affiliations

Intracellular Ca2+ oscillations, a potential pacemaking mechanism in early embryonic heart cells

Philipp Sasse et al. J Gen Physiol. 2007 Aug.

Abstract

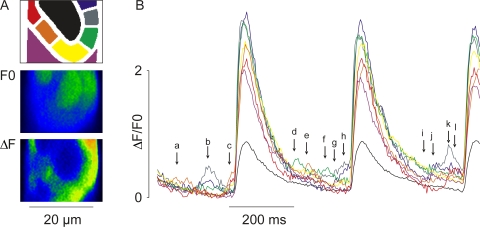
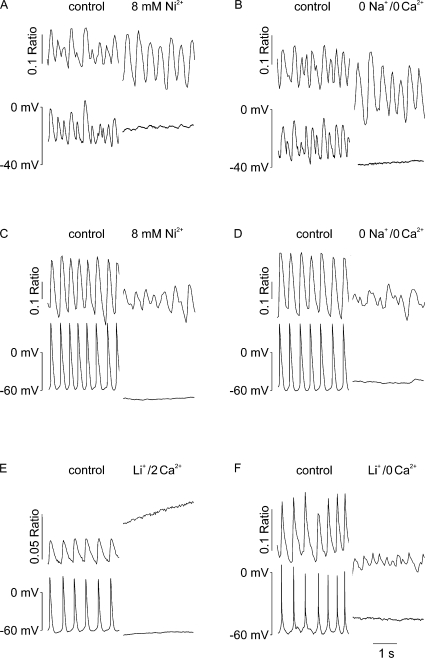
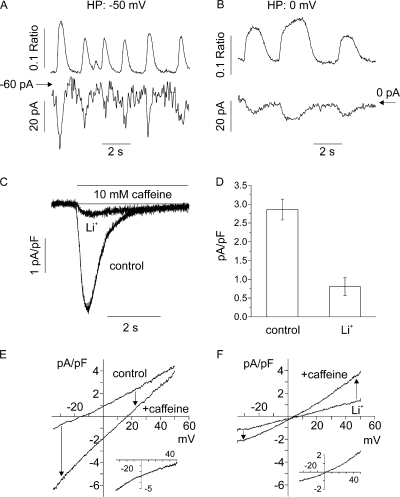
Early (E9.5-E11.5) embryonic heart cells beat spontaneously, even though the adult pacemaking mechanisms are not yet fully established. Here we show that in isolated murine early embryonic cardiomyocytes periodic oscillations of cytosolic Ca(2+) occur and that these induce contractions. The Ca(2+) oscillations originate from the sarcoplasmic reticulum and are dependent on the IP(3) and the ryanodine receptor. The Ca(2+) oscillations activate the Na(+)-Ca(2+) exchanger, giving rise to subthreshold depolarizations of the membrane potential and/or action potentials. Although early embryonic heart cells are voltage-independent Ca(2+) oscillators, the generation of action potentials provides synchronization of the electrical and mechanical signals. Thus, Ca(2+) oscillations pace early embryonic heart cells and the ensuing activation of the Na(+)-Ca(2+) exchanger evokes small membrane depolarizations or action potentials.


Figures

Figure 1.
Figure 1.
Fast 2D confocal imaging identifies small localized [Ca2+]i release events. (A) Mid section of an E10 embryonic cell imaged using 2D confocal fluorescence microscopy at 240 frames/s. (Top) Diagram showing regions subjected to measurements of average fluorescence intensity (black = nuclear region; blue, olive, green, yellow, orange, red = perinuclear regions; purple = remaining cytoplasmic region). F0 shows average fluorescence intensity during the diastolic intervals while ΔF represents the synchronous increase in [Ca2+]i-dependent fluorescence associated with spontaneous repetitive APs. (B) Regional changes in fluorescence intensity measured in 240 frames during a 1-s recording. Colors correspond to the subcellular regions indicated in A, top. Arrows indicate local [Ca2+]i signals of low intensity occurring during diastolic intervals in different perinuclear regions as seen also in Fig. S1.
Figure 2.
Figure 2.
Early embryonic (E8.5–E10.5) cardio (A and C) Examples of cells with contractions (indicated by dashed lines) synchronous to [Ca2+]i (top) and Em (bottom) oscillations without (A) or with primitive APs (C). (B) Fast Fourier transformation (FFT) of [Ca2+]i (top) and Em (bottom) signals from Fig. 2 A revealed identical periodicity. (D) Application of the Na+ channel inhibitor TTX in cells displaying APs and [Ca2+]i transients (left) revealed the underlying basic rhythm of [Ca2+]i and Em oscillations (right). (E) Plotting the [Ca2+]i signal of Fig. 2 D vs. Em results in a hysteresis loop for a single AP (left) and a linear relation for a single [Ca2+]i oscillation after application of TTX (right). For details on the four phases (a–d) see text. F: FFT of [Ca2+]i (top) and Em (bottom) signals from Fig. 2 D shows similar periodicity before (solid lines) and during application of TTX (dashed lines).
Figure 3.
Figure 3.
[Ca2+]i and Em oscillations persist after depolarization or blockade of excitatory inward currents. (A) Current injection (−50 pA) into a current-clamped cell results in an MDP of −70 mV and spontaneous APs with small subthreshold oscillations of [Ca2+]i in between. Upon slowly changing the injected current from −50 pA to + 50 pA the MDP increases and APs disappear. [Ca2+]i oscillations are still present at depolarized potentials (−20 mV, insert 2) and of similar amplitude and frequency as at −70 mV (insert 1). (B and C) [Ca2+]i and Em oscillations persist after blocking either Na+ (B; TTX 10 μM) or L-type Ca2+ channels (C, Nif: nifedipine 1–10 μM).
Figure 4.
Figure 4.
[Ca2+]i oscillations originate from the SR. (A) Application of thapsigargin (2 μM) led to a complete halt of both [Ca2+]i (top) and Em (bottom) oscillations in patch-clamped cells. (B–E) Spontaneous activity ([Ca2+]i oscillations or transients, left) in non (B and C) or perforated patch-clamped (E) and Fura-2-AM–loaded cardiomyocytes was unaltered in the majority of cells upon application of ryanodine (20 μM; B, middle) or 2-APB (100 μM; C, middle), whereas application of both blocked spontaneous activity in all cells (B, C, and E, right). The traces of individual cells (2 in B and 4 in C) were vertically shifted to be better visible. Cells with [Ca2+]i transients could still be field stimulated (C, right, two top traces); APs could be evoked using brief (2-ms) current injections (E, right). (D) Analysis of the experiments shown in B and C.
Figure 5.
Figure 5.
The NCX is responsible for Em oscillations. Blockade of the NCX with Ni2+ (A, 8 mM) or replacement of extracellular Na+ with choline (B) halted or significantly reduced the Em oscillations (bottom) whereas the [Ca2+]i oscillations (top) persisted. Application of Ni2+ (C, 8 mM) or replacement of Na+ with choline (D) or Li+ (F) in cells with APs blocked these completely and converted [Ca2+]i transients into [Ca2+]i oscillations of lower amplitude. Note that removal of Na+ increased [Ca2+]i (E) causing stop of [Ca2+]i oscillations, therefore external Ca2+ also needed to be omitted (B, D, and F) to obtain persisting [Ca2+]i oscillations; this is an additional proof for their intracellular nature. In F, [Ca2+]i oscillations during Li+ application occurred only in a small confined region that was used for the analysis; the remaining cell was silent.
Figure 6.
Figure 6.
Biophysical characterization of the mechanism involved in translating [Ca2+]i into Em oscillations. (A and B) Spontaneous [Ca2+]i oscillations (top) and simultaneous inward currents (bottom) in a voltage-clamped cardiomyocyte. The frequency of [Ca2+]i oscillations and the amplitude of inward currents decreased at a holding potential of 0 mV (B) compared with −50 mV (A). (C) Application of caffeine evoked a large inward current that was significantly reduced when replacing Na+ with Li+ (holding potential −35 mV). (D) Statistical analysis of the caffeine evoked inward current in presence of Na+ and Li+. (E and F) Depolarizing voltage ramps (−35 mV to +50 mV, 250 ms, 1.4 Hz) applied before and in presence of caffeine revealed a linear inward current at potentials <+50 mV (E). When Na+ was replaced by Li+ the current reversed close to 0 mV and had a smaller amplitude (F). Inserts show the subtracted Ca2+-activated currents.
Figure 7.
Figure 7.
[Ca2+]i oscillations are local events in embryonic cardiomyocytes whereas APs synchronize the individual cells. (A–C) Transmission image (A, top) and schematic representation (A, bottom) of a spontaneously beating heart cell. Simultaneous recording of Em (black trace) and [Ca2+]i from four different areas of the cell (red, green, blue, and gray traces) revealed that the [Ca2+]i oscillations occurred synchronously with subthreshold Em oscillations (labeled by 1). These were confined to a small area in the cell (red, green, and blue regions), occurred periodically, and were synchronized but with a slight delay in the three regions indicating the wave-like pattern of [Ca2+]i oscillations (see also Video 3). In the remaining part of the cell (gray region) no changes of [Ca2+]i were detected except during APs (B, labeled by 2). Higher time resolution (C) revealed that the Em was influenced by the spatial summation of [Ca2+]i in all regions. Dashed lines highlight peak [Ca2+]i of the subcellular regions and their depolarizing action on the Em. When [Ca2+]i is highest in all regions, the threshold potential is reached, evoking an AP. (D–F) [Ca2+]i imaging of a spontaneously beating, multicellular cluster of embryonic cardiomyocytes loaded with Fura-2-AM. (D) Transmission picture (top) and schematic representation (bottom). (E) Two subcellular regions (red and green regions and traces) displayed individual [Ca2+]i oscillations between the [Ca2+]i transients; these were synchronized in the whole cell cluster (blue and gray regions and traces). (F) Application of 10 μM TTX blocked the global synchronized [Ca2+]i transients, whereas the two subcellular oscillators remained unperturbed. Electrical field stimulation (indicated by arrows) still evoked synchronized [Ca2+]i transients.

References

    1. Abi-Gerges, N., G.J. Ji, Z.J. Lu, R. Fischmeister, J. Hescheler, and B.K. Fleischmann. 2000. Functional expression and regulation of the hyperpolarization activated non-selective cation current in embryonic stem cell-derived cardiomyocytes. J. Physiol. 523:377–389. - PMC - PubMed
    1. Adachi-Akahane, S., L. Cleemann, and M. Morad. 1996. Cross-signaling between L-type Ca2+ channels and ryanodine receptors in rat ventricular myocytes. J. Gen. Physiol. 108:435–454. - PMC - PubMed
    1. Atri, A., J. Amundson, D. Clapham, and J. Sneyd. 1993. A single-pool model for intracellular calcium oscillations and waves in the Xenopus laevis oocyte. Biophys. J. 65:1727–1739. - PMC - PubMed
    1. Baruscotti, M., and D. DiFrancesco. 2004. Pacemaker channels. Ann. N. Y. Acad. Sci. 1015:111–121. - PubMed
    1. Blatter, L.A., J. Kockskamper, K.A. Sheehan, A.V. Zima, J. Huser, and S.L. Lipsius. 2003. Local calcium gradients during excitation-contraction coupling and alternans in atrial myocytes. J. Physiol. 546:19–31. - PMC - PubMed

Publication types