. 2007 Aug;130(2):183-201.
doi: 10.1085/jgp.200709779.

Responses of rat P2X2 receptors to ultrashort pulses of ATP provide insights into ATP binding and channel gating

Affiliations

Responses of rat P2X2 receptors to ultrashort pulses of ATP provide insights into ATP binding and channel gating

Luciano Moffatt et al. J Gen Physiol. 2007 Aug.

Abstract

To gain insight into the way that P2X(2) receptors localized at synapses might function, we explored the properties of outside-out patches containing many of these channels as ATP was very rapidly applied and removed. Using a new method to calibrate the speed of exchange of solution over intact patches, we were able to reliably produce applications of ATP lasting <200 micros. For all concentrations of ATP, there was a delay of at least 80 micros between the time when ATP arrived at the receptor and the first detectable flow of inward current. In response to 200-micros pulses of ATP, the time constant of the rising phase of the current was approximately 600 micros. Thus, most channel openings occurred when no free ATP was present. The current deactivated with a time constant of approximately 60 ms. The amplitude of the peak response to a brief pulse of a saturating concentration of ATP was approximately 70% of that obtained during a long application of the same concentration of ATP. Thus, ATP leaves fully liganded channels without producing an opening at least 30% of the time. Extensive kinetic modeling revealed three different schemes that fit the data well, a sequential model and two allosteric models. To account for the delay in opening at saturating ATP, it was necessary to incorporate an intermediate closed state into all three schemes. These kinetic properties indicate that responses to ATP at synapses that use homomeric P2X(2) receptors would be expected to greatly outlast the duration of the synaptic ATP transient produced by a single presynaptic spike. Like NMDA receptors, P2X(2) receptors provide the potential for complex patterns of synaptic integration over a time scale of hundreds of milliseconds.


Figures
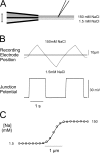
Figure 1.
Figure 1.
Properties of solution exchange with open-tipped recording pipettes. (A) Diagram of system for rapidly changing the solution bathing outside-out patches. Different solutions flow through the two barrels of the pipette, and outflow is controlled by pressure applied to the solution reservoirs and by the opening and closing of solenoid valves. The arrow indicates the direction of movement of the drug application pipette in response to control pulses from the computer. A second computer controlled a piezoelectric manipulator that could be used to adjust the position of the recording pipette relative to the solution interface. (B) The change in junction potential when the solution boundary between 150 mM NaCl and 1.5 mM NaCl was moved across the recording pipette at low speed (40 μm/s). The 33-mV shift indicates that these data are as predicted from the Henderson equation. (C) The junction potential measured at closely spaced distances indicated that the 10–90% range of the concentration profile is ∼0.7 μm.
Figure 2.
Figure 2.
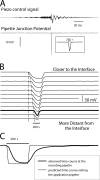
Movements of the solution boundary between 150 and 1.5 mM NaCl can be made very rapidly. (A) The optimal command potential to the piezo driver moving the drug application pipette necessary to damp out vibrations was complex. The top traces show the command potential, and the bottom trace shows a single sharp spike in the junction potential. The time course of the junction potential waveform at higher temporal resolution is illustrated in the inset box. (B) The pipette junction potential in response to a fixed stimulus to the piezo controlling the position of the drug application pipette is plotted for 12 different positions of the recording pipette. In all cases the recording pipette began in the 150 mM NaCl solution and the initial potential was 0 mV. The top trace was obtained when the recording pipette was close to the boundary, and each subsequent trace was 0.67 μm more distant. The heavy black trace indicates a position where this stimulus produced a pulse lasting ∼200 μs. The dashed lines indicate the difference between the latency until a response began at the position closest to the boundary and the beginning of a response in each subsequent trace. The velocity of the piezo movement was estimated from these lines to be ∼45 μm/ms. (C) Predicted and observed time courses of the solution exchange. The thin line indicates the concentration profile expected based on a velocity of the piezo of 45 μm/ms. The thick line indicates the concentration profile actually obtained, and was calculated from the thick trace in B using the Henderson equation.
Figure 3.
Figure 3.
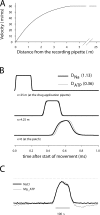
Numerical analysis of the predicted concentration profile at the recording pipette based on the one-dimensional diffusion-convection equation. (A) Velocity as a function of the distance from the tip used for the numerical integration. The maximal velocity is the fluid velocity (v). These data were obtained from a two-dimensional integration of the Bernoulli equation by Sachs (1999) and represent the values that would be obtained for a recording pipette with a radius of 1.2 μm. (B) The predicted time course of appearance and disappearance of ATP and Na in response to stimulus that produces a 200-μs duration response at the patch. The amplitudes of all responses are normalized to 100% of the maximum response at that point. The parameters used for the fit were diffusion coefficientNa = 1.133, diffusion coefficientATP = 0.36, fluid velocity = 60 μm/ms, recording pipette radius = 1.2 μm. (C) The measured time course of the open tip junction potential as the NaCl concentration or the MgATP concentration increased and decreased between 1 and 10 mM. The junction potential values were normalized to facilitate their comparison. The dashed line indicates the maximum amplitude of the junction potential for a long pulse.
Figure 4.
Figure 4.
Variability in the rate of rise in ATP-evoked currents. The responses were normalized so that they all reached the same maximal amplitude. For all four patches, the junction potential obtained after the patch was ruptured was very rapid, indicating that the recording pipettes had been correctly placed relative to the solution boundary.
Figure 5.
Figure 5.
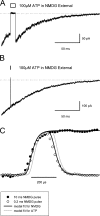
Demonstration of the method used to determine the speed of solution exchange on intact patches. One barrel of the drug application pipette contained normal sodium external solution without ATP and the other contained NMDG external solution with 100 μM ATP. (A) Just before the start of the trace the patch was switched out of a solution containing a mixture of NMDG and sodium solutions with ATP into the sodium solution without ATP, so that many channels were open and there was a significant inward driving force but no ATP was present. At the time indicated by the box, the patch was shifted into the NMDG solution with 100 μM ATP for 10 ms, and then back into the sodium containing solution with no ATP. (B) The procedure was the same as in A but the NMDG pulse lasted only 0.2 ms. (C) Time detail of both pulses. The currents were normalized to facilitate comparison. The peak current reduction in response to the 0.2-ms pulse (open circles) was 93% of the reduction in the 10-ms pulse (filled circles). The black lines show the expected time course of the responses to NMDG after integrating the convection-diffusion equation. For times longer than 200 μs after the start of the pulse, the black line predicting the response to the 10-ms pulse is obscured by the gray line predicting the response to a 10-ms pulse of ATP. We optimized the parameters r (radius of the pipette) and v (velocity of the fluid coming out of the application pipe) to obtain the best fit. The gray lines show the deduced time course of the ATP concentration by integrating the same equation with the same parameters except using the diffusion constant for ATP.
Figure 6.
Figure 6.
Scatterplot demonstrating that a slow rate of exchange can account for the patches in which the response to ATP was slow.
Figure 7.
Figure 7.
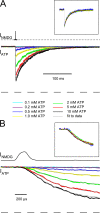
Response of a patch expressing P2X2 receptors to the application of 200-μs pulses of ATP at 0.1, 0.2, 0.5, 1, 2, 5, and 10 mM. The membrane potential was held at −60 mV. (A) The top trace shows the time course of the response to a 200-μs pulse of NMDG external solution (as in Fig. 5), to test the speed of solution exchange. The lower set of colored traces are the current responses to the indicated concentrations of ATP and the smooth gray traces are the fits of Eq. 5 to these data. The amplitude of the traces was normalized to the amplitude of 10-ms pulses of 1 mM ATP (which evoked maximal amplitude of response). The inset shows the current responses for 500 μM and greater concentrations normalized to the same peak amplitude. (B) The same data as in A shown on a much more rapid time scale.
Figure 8.
Figure 8.
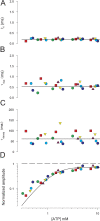
Responses to 200-μs pulses of ATP at a variety of different concentrations from six different patches. The ATP-evoked current from each trace was fit to Eq. 4, and the parameters from the fit (tδ, τrise, τdecay, and A) were plotted as a function of the normalized concentration of ATP. Each point represents a single response; each symbol represents a different patch. Time delay (tδ) was measured from the start of the pulse (defined as the time when 10% of the response to NMDG was reached) to the time when the back-extrapolated rising exponential current in response to ATP was zero. Normalized ATP concentration was calculated by multiplying the ATP concentration by a scaling factor equal to the duration of the brief NMDG calibration pulse (in μs) divided by 200 μs.
Figure 9.
Figure 9.
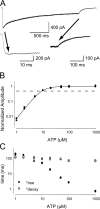
Responses of a single patch to long pulses of ATP at a variety of ATP concentrations. (A) Trace of one patch in response to a 2-s application of 1,000 μM ATP. The two bottom traces show portions of the full trace at higher time resolution. Desensitization was negligible in the first 20 ms of the response, but was apparent at longer times, with a time constant of ∼620 ms. The deactivation after ATP was removed was much slower than the onset of the ATP response. (B) Peak current as a function of ATP concentration for long pulses of ATP. The dashed line represents the maximal current that could be obtained for a 200-μs pulse of 10 mM ATP. (C) The time constant of the rising and falling phases of the response to long pulses of ATP at various concentrations.
Figure 10.
Figure 10.
Initial kinetic analysis. (A) Minimal linear scheme for a homotrimeric channel in which all binding sites must be occupied before channel opening can occur. Sub-Scheme 1a represents the possible transitions once all of the ATP has been washed away, and sub-Scheme 1b represents the transitions that will occur during an ultrashort pulse if β and 3Koff are slow relative to the duration of the pulse. (B) The global fitting of data to Scheme 1. The colored lines match the data points of the same color. The gray line represents the predicted time course of ATP based on the time course of the response to an NMDG pulse. The full dataset is shown on log axes on the left, and the earliest phase of the responses is shown on linear coordinates on the right.
Figure 11.
Figure 11.
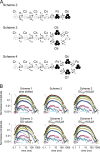
Further kinetic analysis. Comparison of experimental data with predictions of Schemes 2–4. (A) Schemes 2–4. Scheme 2 is a modification of Scheme 1 in which one additional closed state (the flip state) was added between the fully liganded channel and the open state. Scheme 3 is the preferred model of Ding and Sachs (1999). Scheme 4 inserts a flipped state into Scheme 3. (B) Global fit to the data generated by the different schemes. For time-shifted Scheme 1, a delay in the time of the drug application was included as an extra parameter in the global fit. The rationale was to mimic possible artifacts introduced by the drug application method. For the indicated schemes, the fit was forced to obey an EC50 of 9.8. For Scheme 3 we provide the prediction of the kinetic values obtained in the Ding and Sachs study. The solid lines are specific to each model, but the data points are identical in all panels.
Figure 12.
Figure 12.
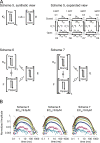
Allosteric analysis. (A) Schemes 5–7. Scheme 5 is the Monod-Wyman-Changeux model for a channel with three independent binding sites and, therefore, the allosteric extension of Scheme 1. Scheme 5 considers the allosteric interaction of two components: the binding sites and the gate. Each binding site can be either free or bound and the gate can be either closed or open. The expanded view shows the six states of the scheme and the formulas for the kinetic rates in terms of eight parameters: the same four kinetic rates of Scheme 1 (the binding and unbinding constants kon and koff and the opening and closing rates β and α) and the rate allosteric factors for each one of them (Akon, Akoff, A α, A β). Scheme 6 is the allosteric expansion of Scheme 2; it includes flipping as a third component and it considers three allosteric couplings: binding–gating, binding–flipping, and flipping–gating. The expanded view is in Fig. S1. Scheme 7 is an alternative to Scheme 6 where flipping occurs independently at each binding site. The expanded view is presented in Figs. S2 and S3. (B) Global fits (solid lines) to the data (identical in all panels) using allosteric Schemes 5–7. Fits were forced to obey an EC50 of 9.8.

Similar articles

Cited by

References

    1. Banke, T.G., and S.F. Traynelis. 2003. Activation of NR1/NR2B NMDA receptors. Nat. Neurosci. 6:144–152. - PubMed
    1. Barry, P.H., and J.W. Lynch. 1991. Liquid junction potentials and small cell effects in patch-clamp analysis. J. Membr. Biol. 121:101–117. - PubMed
    1. Bartoletti, S., B.D. Flury, and D.G. Nel. 1999. Allometric extension. Biometrics. 55:1210–1214. - PubMed
    1. Beato, M., P.J. Groot-Kormelink, D. Colquhoun, and L.G. Sivilotti. 2004. The activation mechanism of α1 homomeric glycine receptors. J. Neurosci. 24:895–906. - PMC - PubMed
    1. Brooks, S.P., and K.B. Storey. 1992. Bound and determined: a computer program for making buffers of defined ion concentrations. Anal. Biochem. 201:119–126. - PubMed

Publication types