

doi: 10.1073/pnas.0704079104.
Epub 2007 Jul 30.
Two-dimensional spectroscopy at infrared and optical frequencies
Affiliations
- PMID: 17664429
- PMCID: PMC1964834
- DOI: 10.1073/pnas.0704079104
Item in Clipboard
Two-dimensional spectroscopy at infrared and optical frequencies
Proc Natl Acad Sci U S A.
.
Abstract
This Perspective on multidimensional spectroscopy in the optical and infrared spectral regions focuses on the principles and the scientific and technical challenges facing these new fields. The methods hold great promise for advances in the visualization of time-dependent structural changes in complex systems ranging from liquids to biological assemblies, new materials, and fundamental physical processes. The papers in this special feature on multidimensional spectroscopy in chemistry, physics, and biology are typical of many recent advances.
Conflict of interest statement
The author declares no conflict of interest.
Figures
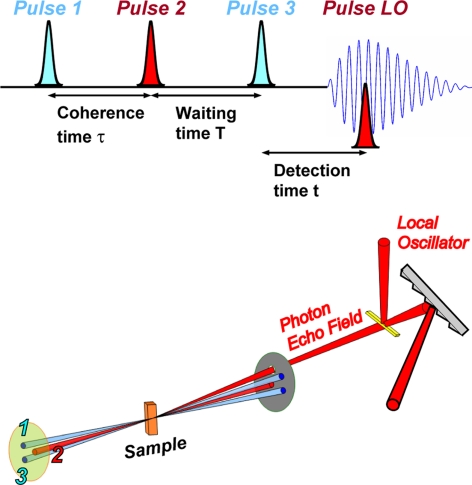
Outlines of 2D photon echo methods. (Upper) Typical pulse sequence used in 2D experiments that may involve two frequencies (represented by blue and red pulses). (Lower) Scheme of the phase-matched 2D photon echo experiment. The heterodyne pulse is the local oscillator.
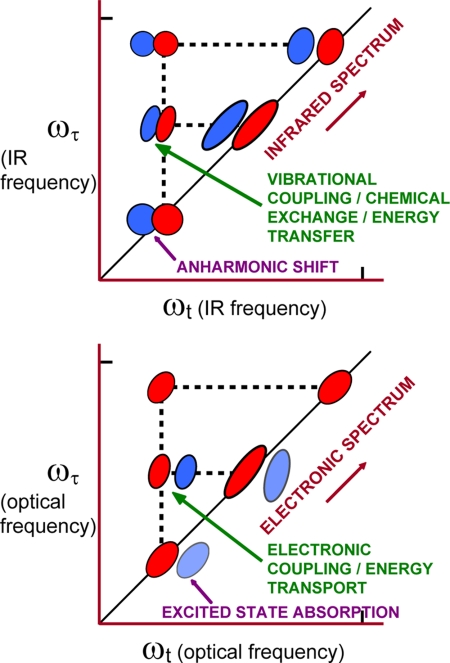
Global features of 2D echo spectra. The red and blue regions represent signals having opposite signs. Their shapes are determined by the frequency distributions and the vibrational or electronic dynamics and are not known a priori. Note the different topologies for IR (Upper) and optical (Lower) 2D spectra.
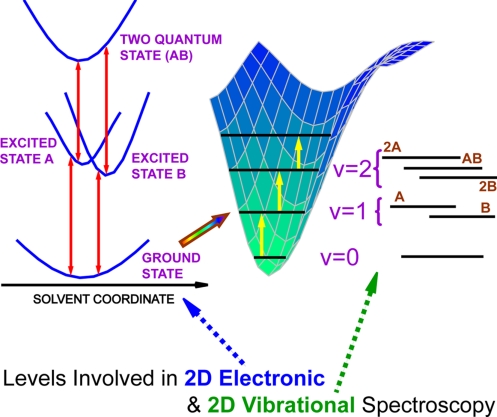
Cartoons of energy levels and transitions involved in 2D electronic and vibrational spectroscopy. (Left) Typical electronic energy states for a pair of chromophores. (Right) Anharmonic levels typically involved in 2D IR experiments on a pair of coupled oscillators.
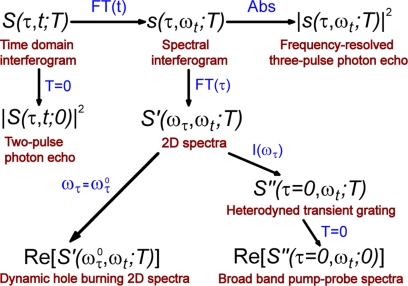
Relationships among various nonlinear experiments and 2D interferograms. FT, Fourier transform; Abs, absolute value; I(ω), integrate over all ω; Re, take real part.
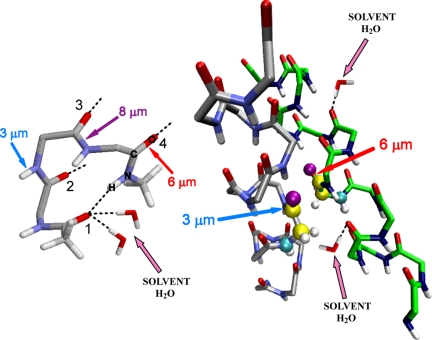
Structural motifs seen by multicolor 2D IR to expose vibrational coupling, tertiary interactions, and solvent fluctuations. The IR wavelengths are in micrometers. The arrows point to bonds or local vibrations that are typically accessed in experiments. Internal and solvent H-bonding are represented. (Left) A typical peptide backbone structure and the features accessed by 2D IR. (Right) The backbone of a helix dimer typically found in transmembrane environments and representations of the properties accessed by 2D IR.
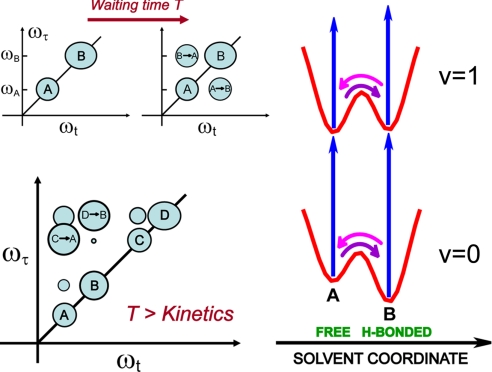
Using 2D IR spectroscopy exposes chemical kinetics in solution. (Left) Idealized 2D IR spectra for a pair of exchanging structures (Upper) and a network for the case in which the mixing time is long compared with the kinetic constants (Lower). (Right) Typical variation of the high-frequency vibrational energies with solvent coordinate. Note that the exchange kinetics may be different in different vibrational states.
References
-
- Ernst RR, Bodenhausen G, Wokaun A. Principles of Nuclear Magnetic Resonances in One and Two Dimensions. Oxford: Clarendon; 1987.
-
- Hamm P, Lim M, Hochstrasser RM. J Phys Chem B. 1998;102:6123–6138.
-
- Mukamel S. Annu Rev Phys Chem. 2000;51:691–729. - PubMed
Publication types
MeSH terms
Substances
Grants and funding
LinkOut - more resources
Full Text Sources
Other Literature Sources
