

doi: 10.1073/pnas.0610081104.
Epub 2007 Jul 30.
New directions in single-molecule imaging and analysis
Affiliations
- PMID: 17664434
- PMCID: PMC1937512
- DOI: 10.1073/pnas.0610081104
Item in Clipboard
New directions in single-molecule imaging and analysis
Proc Natl Acad Sci U S A.
.
Erratum in
- Proc Natl Acad Sci U S A. 2007 Sep 25;104(39):15584
Abstract
Optical imaging and analysis of single molecules continue to unfold as powerful ways to study the individual behavior of biological systems, unobscured by ensemble averaging. Current expansion of interest in this field is great, as evidenced by new meetings, journal special issues, and the large number of new investigators. Selected recent advances in biomolecular analysis are described, and two new research directions are summarized: superresolution imaging using single-molecule fluorescence and trapping of single molecules in solution by direct suppression of Brownian motion.
Conflict of interest statement
The author declares no conflict of interest.
Figures
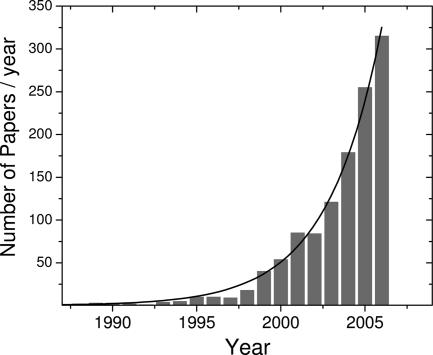
Numbers of papers indexed in the PubMed database with “single molecule” in the title (image courtesy of Taekjip Ha); exponential growth with doubling time of 2.2 years.
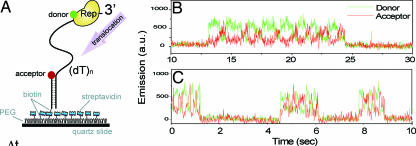
Explorations of the sliding behavior of Rep on a single-stranded DNA segment attached to a surface. (A) Schematic of the labeling arrangement for FRET measurements. Traces (B, 22°C; C, 37°C) of donor (green) and acceptor (red) fluorescence signals for a single Rep molecule are shown. [Reproduced with permission from ref. (Copyright 2005, MacMillian Publishers, Ltd.).]
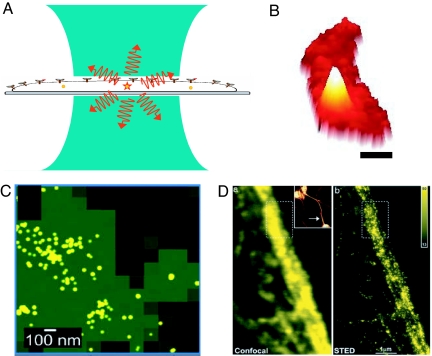
Overview of superresolution imaging. (A) Schematic of a tightly focused laser beam (blue) of diffraction-limited diameter of ≈200 nm irradiating a cell. One molecule is in the focal volume, which emits fluorescence (red). (B) Wide-field fluorescence image of a bacterial cell (red) containing a single protein fusion between the bacterial actin MreB and EYFP (mountain). Acquisition time, 100 ms. (Scale bar, 0.5 μm.) (C) Fluorescence PALM image of PA-GFP molecules on a glass substrate, with green regions showing the approximate blur region of diffraction-limited imaging and yellow dots showing the actual detected positions of the single molecules. [Reproduced with permission from ref. (Copyright 2006, Biophysical Society).] (D) Confocal (Left) and STED (Right) images of a neurofilament in a human neuroblastoma cell labeled by immunofluorescence. [Reproduced with permission from ref. (Copyright 2006, National Academy of Sciences).]
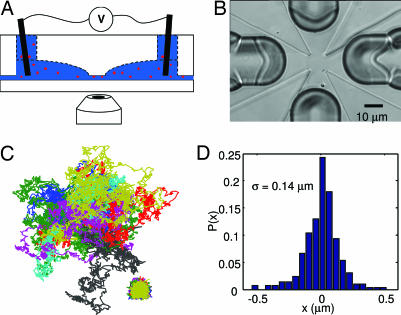
Trapping single molecules in solution with the ABEL trap. (A) Schematic side view of the ABEL trap showing that the microfluidic cell sits above the oil-immersion objective of an inverted fluorescence microscope. Confinement in the z direction along the axis of the microscope is produced by the thin gap between the upper transparent structure and a flat coverslip. Four electrodes are placed in the solution far away from the central trapping region. (B) Top view of the microfluidic cell, showing the trapping region ≈10 × 10 μm in size in the center. Four deep milled channels extend out in the +/− x and +/− y directions. The four sharply pointed raised regions serve to define the thickness of the trap in the z direction normal to the page. (C) Measured (lower right) and pseudofree (center) trajectories of 13 trapped particles of TMV. [Reproduced with permission from ref. (Copyright 2006, National Academy of Sciences).] (D) Position probability distribution of a single fluorescently labeled molecule of the chaperonin, GroEL, trapped in buffer. The standard deviation is shown.
References
Publication types
MeSH terms
Substances
Grants and funding
LinkOut - more resources
Full Text Sources
Other Literature Sources
