Comparative Study
. 2007 Sep;17(9):1266-77.
doi: 10.1101/gr.6557307. Epub 2007 Jul 31.

Gene copy number variation spanning 60 million years of human and primate evolution

Affiliations
Comparative Study

Gene copy number variation spanning 60 million years of human and primate evolution

Laura Dumas et al. Genome Res. 2007 Sep.

Abstract

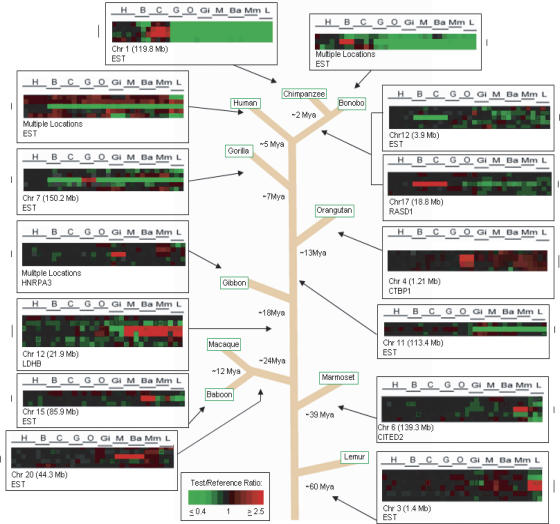
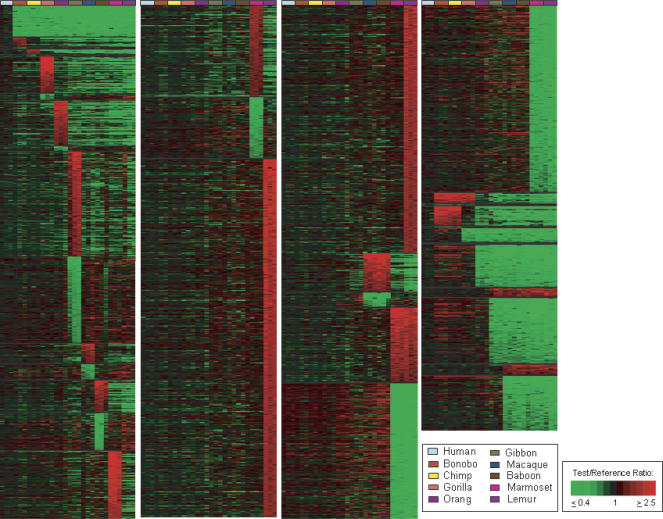
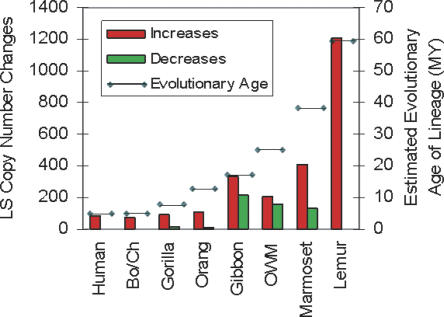
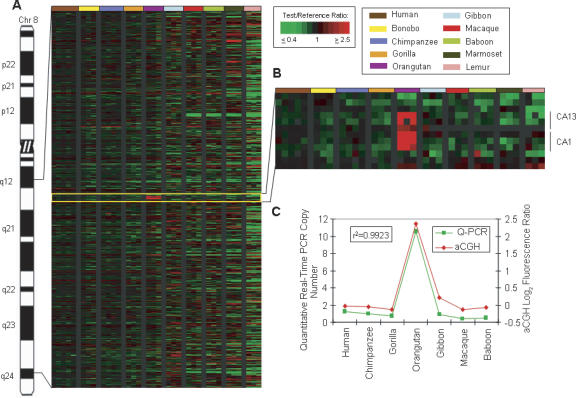
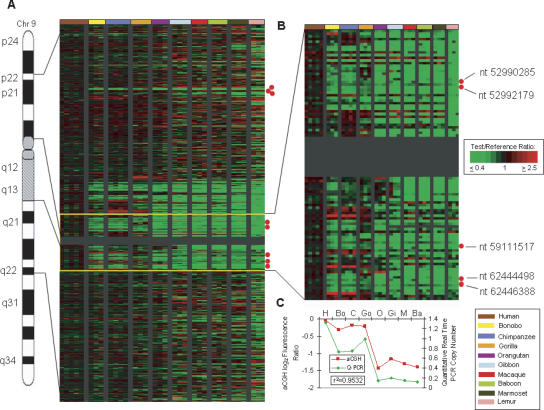
Given the evolutionary importance of gene duplication to the emergence of species-specific traits, we have extended the application of cDNA array-based comparative genomic hybridization (aCGH) to survey gene duplications and losses genome-wide across 10 primate species, including human. Using human cDNA arrays that contained 41,126 cDNAs, corresponding to 24,473 unique human genes, we identified 4159 genes that likely represent most of the major lineage-specific gene copy number gains and losses that have occurred in these species over the past 60 million years. We analyzed 1,233,780 gene-to-gene data points and found that gene gains typically outnumbered losses (ratio of gains/losses = 2.34) and these frequently cluster in complex and dynamic genomic regions that are likely to serve as gene nurseries. Almost one-third of all human genes (6696) exhibit an aCGH- predicted change in copy number in one or more of these species, and within-species gene amplification is also evident. Many of the genes identified here are likely to be important to lineage-specific traits including, for example, human-specific duplications of the AQP7 gene, which represent intriguing candidates to underlie the key physiological adaptations in thermoregulation and energy utilization that permitted human endurance running.


Figures

Figure 1.
Figure 1.
Lineage-specific gene copy number changes among primate species. Examples of lineage-specific (LS) gene copy number changes across 10 primate species studied, as well as the divergence times in millions of years (Myr), from a last common ancestor with the human lineage, for each species: 5 Myr for chimpanzee, 5 Myr for bonobo, 2 Myr for chimp/bonobo split, 7 Myr for gorilla, 13 Myr for orangutan, 18 Myr for gibbon, 24 Myr for OWM, 39 Myr for NWM, and 60 Myr for lemurs (Jobling et al. 2004). Each vertical column represents data from one cDNA aCGH microarray experiment; the horizontal line represents data from one cDNA clone on the microarray, each of which is ordered according to human genome position. Arrows indicate to which primate lineage the LS change belongs. The estimated time frame of occurrence of LS changes is predicted using parsimony.
Figure 2.
Figure 2.
Treeview image of genes showing lineage-specific copy number changes among 10 primate species. Treeview image of 7318 genes giving LS aCGH signatures are shown for each of 10 lineages, including human (blue-gray), bonobo (rust), chimp (yellow), gorilla (orange), orangutan (purple), gibbon (green), macaque (blue), baboon (brown), marmoset (magenta), and lemur (light purple), as well as Old World Monkeys (OWM), marmoset and lemur, African Great Apes, Pan lineage (bonobo and chimp together), and combined aCGH-predicted changes relative to the remaining extended primates for the following groups: human and Pan lineage, human and African great apes, human and great apes, and human and all apes (great and lesser). The LS signals are grouped according to lineage and within each lineage are ordered, highest to lowest, according to the log2 fluorescence ratio of the signal intensity of test sample to reference sample. Colors are displayed using a pseudocolor scale as shown. The green signals indicate LS decreases with respect to human, and the red signals indicate LS increases with respect to human.
Figure 3.
Figure 3.
LS increases and decreases and corresponding evolutionary age of each lineage. The total number of LS increases and decreases is shown as red and green bars, representing copy number gains and losses, respectively. The number of increases/decreases for each lineage is as follows: human 84/0, Pan lineage 75/4, gorilla 88/14, orangutan 107/10, gibbon 336/213, OWM (baboon and macaque combined) 211/158, marmoset 408/135, and lemur 1209/3530.The evolutionary age of each lineage in millions of years (depicted by the horizontal line) refers to the approximate divergence times from a last common ancestor with the human lineage and is the same as described in Figure 1.
Figure 4.
Figure 4.
Orangutan-specific amplification of carbonic anhydrase (CA) genes. (A) Human chromosome 8 is shown with a Treeview image corresponding to 8q12.1–q24.1. The Treeview image depicts the aCGH log2 fluorescence ratio in pseudocolor as shown, with green and red signals indicative of a copy number decrease and increase, respectively, relative to human. Each cDNA is ordered according to human genome position. All individuals from one species are color-coded as shown. (B) Enlarged Treeview image of an orangutan LS increase involving a block of six contiguous amplified cDNA signals, including three cDNAs corresponding to the carbonic anhydrase 13 (CA13) gene and three cDNAs correlating to the carbonic anhydrase 1 (CA1) gene. (C) The graph shows the aCGH log2 fluorescence ratio (red) plotted against the Q-PCR values (green) for the CA genes for 10 primate species. The correlation coefficient for the two data sets is r2 = 0.9923.
Figure 5.
Figure 5.
Human LS amplification of the aquaporin 7 (AQP7) gene relative to other primates. (A) Human chromosome 9 is shown with the Treeview image corresponding to 9p22–9q22. The Treeview image depicts the aCGH log2 fluorescence ratio in pseudocolor as shown, with green and red signals indicative of a copy number decrease and increase, respectively, relative to human. Each cDNA is ordered according to human genome position. All individuals from one species are color-coded as shown. The red dots signify locations of AQP7-related cDNAs. (B) Enlarged Treeview image for the region adjacent to the C-band that includes five copies of AQP7. (C) The graph shows the aCGH log2 fluorescence ratio (red) plotted against the Q-PCR values (green) for the AQP7 gene for 10 primate species. The correlation coefficient for the two data sets is r2 = 0.9532.

References

    1. Autism Genome Project Consortium Mapping autism risk loci using genetic linkage and chromosomal rearrangements. Nat. Genet. 2007;39:319–328. - PMC - PubMed
    1. Bailey J.A., Gu Z., Clark R.A., Reinert K., Samonte R.V., Schwartz S., Adams M.D., Myers E.W., Li P.W., Eichler E.E., Gu Z., Clark R.A., Reinert K., Samonte R.V., Schwartz S., Adams M.D., Myers E.W., Li P.W., Eichler E.E., Clark R.A., Reinert K., Samonte R.V., Schwartz S., Adams M.D., Myers E.W., Li P.W., Eichler E.E., Reinert K., Samonte R.V., Schwartz S., Adams M.D., Myers E.W., Li P.W., Eichler E.E., Samonte R.V., Schwartz S., Adams M.D., Myers E.W., Li P.W., Eichler E.E., Schwartz S., Adams M.D., Myers E.W., Li P.W., Eichler E.E., Adams M.D., Myers E.W., Li P.W., Eichler E.E., Myers E.W., Li P.W., Eichler E.E., Li P.W., Eichler E.E., Eichler E.E. Recent segmental duplications in the human genome. Science. 2002;297:1003–1007. - PubMed
    1. Bond J., Woods C.G., Woods C.G. Cytoskeletal genes regulating brain size. Curr. Opin. Cell Biol. 2006;18:95–101. - PubMed
    1. Bond J., Roberts E., Springell K., Lizarraga S.B., Scott S., Higgins J., Hampshire D.J., Morrison E.E., Leal G.F., Silva E.O., Roberts E., Springell K., Lizarraga S.B., Scott S., Higgins J., Hampshire D.J., Morrison E.E., Leal G.F., Silva E.O., Springell K., Lizarraga S.B., Scott S., Higgins J., Hampshire D.J., Morrison E.E., Leal G.F., Silva E.O., Lizarraga S.B., Scott S., Higgins J., Hampshire D.J., Morrison E.E., Leal G.F., Silva E.O., Scott S., Higgins J., Hampshire D.J., Morrison E.E., Leal G.F., Silva E.O., Higgins J., Hampshire D.J., Morrison E.E., Leal G.F., Silva E.O., Hampshire D.J., Morrison E.E., Leal G.F., Silva E.O., Morrison E.E., Leal G.F., Silva E.O., Leal G.F., Silva E.O., Silva E.O., et al. A centrosomal mechanism involving CDK5RAP2 and CENPJ controls brain size. Nat. Genet. 2005;37:353–355. - PubMed
    1. Bramble D.M., Lieberman D.E., Lieberman D.E. Endurance running and the evolution of Homo. Nature. 2004;432:345–352. - PubMed

Publication types