Comparative Study
. 2007 Jul;18(6-7):463-72.
doi: 10.1007/s00335-007-9043-3. Epub 2007 Aug 1.

Weighted gene coexpression network analysis strategies applied to mouse weight

Affiliations
Comparative Study

Weighted gene coexpression network analysis strategies applied to mouse weight

Tova F Fuller et al. Mamm Genome. 2007 Jul.

Abstract

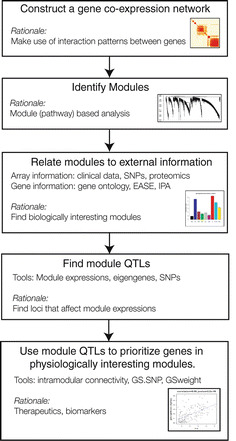
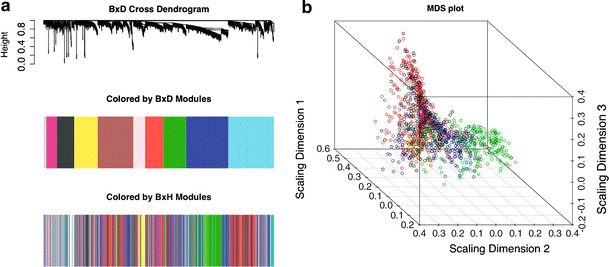
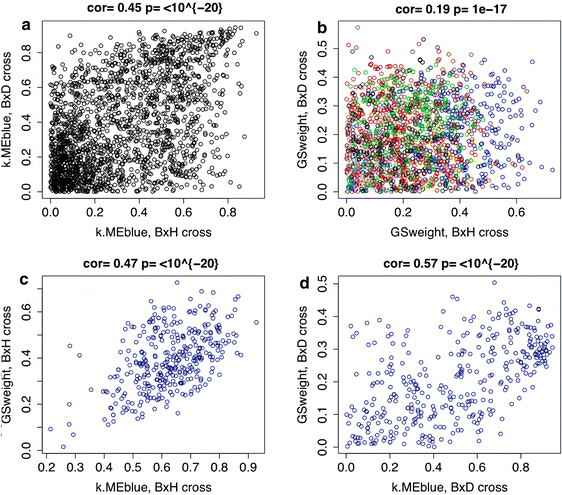
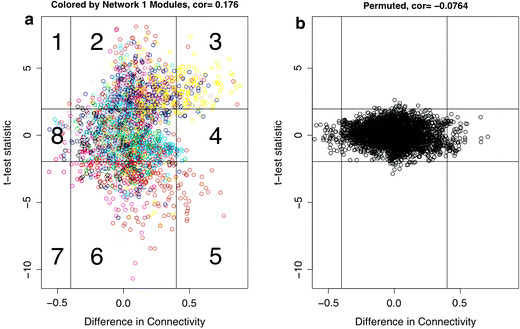
Systems-oriented genetic approaches that incorporate gene expression and genotype data are valuable in the quest for genetic regulatory loci underlying complex traits. Gene coexpression network analysis lends itself to identification of entire groups of differentially regulated genes-a highly relevant endeavor in finding the underpinnings of complex traits that are, by definition, polygenic in nature. Here we describe one such approach based on liver gene expression and genotype data from an F(2) mouse inter-cross utilizing weighted gene coexpression network analysis (WGCNA) of gene expression data to identify physiologically relevant modules. We describe two strategies: single-network analysis and differential network analysis. Single-network analysis reveals the presence of a physiologically interesting module that can be found in two distinct mouse crosses. Module quantitative trait loci (mQTLs) that perturb this module were discovered. In addition, we report a list of genetic drivers for this module. Differential network analysis reveals differences in connectivity and module structure between two networks based on the liver expression data of lean and obese mice. Functional annotation of these genes suggests a biological pathway involving epidermal growth factor (EGF). Our results demonstrate the utility of WGCNA in identifying genetic drivers and in finding genetic pathways represented by gene modules. These examples provide evidence that integration of network properties may well help chart the path across the gene-trait chasm.


Figures

Fig. 1
Fig. 1
Overview of weighted gene coexpression network analysis (single-network analysis)
Fig. 2
Fig. 2
a (Top) Average linkage hierarchical clustering dendrogram of the B × D cross. (Middle) Visualization of the modules in the B × D network; module colors correspond to branches of the dendrogram shown above. (Bottom) Visualization of rough module preservation. Here we color the genes by the colors of the original B × H (not B × D) cross. The fact that colors stay together suggests module preservation. b Multidimensional scaling (MDS) plot of B × D mouse cross data, with coloring by B × H module definitions
Fig. 3
Fig. 3
a Scatterplot of kME in both crosses. kME describes each eigengene’s connectivity to the Blue module. The value for the B × D cross (y axis) is plotted against the value in the B × H data set (x axis). b Scatterplot between GSweight for all genes in the B × D cross (y axis) and in the B × H cross (x axis). Colors depict B × H module membership. c Scatterplot between GSweight (y axis) and kME (x axis) in the B × H data set in genes that overlapped with the B × D cross. d Same as (c), except in the B × D cross. Spearman correlation coefficients are reported above all plots
Fig. 4
Fig. 4
Sector plots of differential network analysis. In (a) and (b), difference in connectivity (DiffK) is plotted on the x axis, and t-test statistic values are plotted on the y axis. Horizontal lines indicate a difference in connectivity of −0.4 and 0.4, whereas vertical lines depict a t-statistic value of −1.96 or 1.96. a Observed DiffK and t-statistic values: Genes are colored based on network 1 module definitions. Numbers indicate sectors 1–8. b Corresponding sector plot for a permuted network where array samples in data sets 1 and 2 were randomly permuted

References

    1. Abdollahi M, Cushman M, Rosendaal FR. Obesity: risk of venous thrombosis and the interaction with coagulation factor levels and oral contraceptive use. Thromb Haemost. 2003;89:493–498. doi: 10.1055/s-0037-1613379. - DOI - PubMed
    1. Almind K, Kahn CR. Genetic determinants of energy expenditure and insulin resistance in diet-induced obesity in mice. Diabetes. 2004;53:3274–3285. doi: 10.2337/diabetes.53.12.3274. - DOI - PubMed
    1. Bischof JM, Wevrick R. Genome-wide analysis of gene transcription in the hypothalamus. Physiol Genomics. 2005;22:191–196. doi: 10.1152/physiolgenomics.00071.2005. - DOI - PubMed
    1. Bystrykh L, Weersing E, Dontje B, Sutton S, Pletcher MT, et al. Uncovering regulatory pathways that affect hematopoietic stem cell function using ‘genetical genomics’. Nat Genet. 2005;37:225–232. doi: 10.1038/ng1497. - DOI - PubMed
    1. Chen J, Lipska BK, Halim N, Ma QD, Matsumoto M, et al. Functional analysis of genetic variation in catechol-O-methyltransferase (COMT): effects on mRNA, protein, and enzyme activity in postmortem human brain. Am J Hum Genet. 2004;75:807–821. doi: 10.1086/425589. - DOI - PMC - PubMed

Publication types