. 2007 Aug;81(2):252-63.
doi: 10.1086/519248. Epub 2007 Jun 20.

Natural gene-expression variation in Down syndrome modulates the outcome of gene-dosage imbalance

Affiliations

Natural gene-expression variation in Down syndrome modulates the outcome of gene-dosage imbalance

Paola Prandini et al. Am J Hum Genet. 2007 Aug.

Abstract

Down syndrome (DS) is characterized by extensive phenotypic variability, with most traits occurring in only a fraction of affected individuals. Substantial gene-expression variation is present among unaffected individuals, and this variation has a strong genetic component. Since DS is caused by genomic-dosage imbalance, we hypothesize that gene-expression variation of human chromosome 21 (HSA21) genes in individuals with DS has an impact on the phenotypic variability among affected individuals. We studied gene-expression variation in 14 lymphoblastoid and 17 fibroblast cell lines from individuals with DS and an equal number of controls. Gene expression was assayed using quantitative real-time polymerase chain reaction on 100 and 106 HSA21 genes and 23 and 26 non-HSA21 genes in lymphoblastoid and fibroblast cell lines, respectively. Surprisingly, only 39% and 62% of HSA21 genes in lymphoblastoid and fibroblast cells, respectively, showed a statistically significant difference between DS and normal samples, although the average up-regulation of HSA21 genes was close to the expected 1.5-fold in both cell types. Gene-expression variation in DS and normal samples was evaluated using the Kolmogorov-Smirnov test. According to the degree of overlap in expression levels, we classified all genes into 3 groups: (A) nonoverlapping, (B) partially overlapping, and (C) extensively overlapping expression distributions between normal and DS samples. We hypothesize that, in each cell type, group A genes are the most dosage sensitive and are most likely involved in the constant DS traits, group B genes might be involved in variable DS traits, and group C genes are not dosage sensitive and are least likely to participate in DS pathological phenotypes. This study provides the first extensive data set on HSA21 gene-expression variation in DS and underscores its role in modulating the outcome of gene-dosage imbalance.


Figures
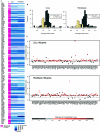
Figure  1.
Figure 1.
A, Representation of HSA21 genes analyzed. In the first column, dark pink indicates assays with efficiency (E) 0.95–1.05, light pink indicates assays with efficiency <0.95 (not used in this study), and white indicates assays not designed (see selection criteria in the “Material and Methods” section). The different shades of blue represent the average level of expression for each gene in LCLs and fibroblasts; genes with no expression data available are in white. B, Histograms of average ratio of expression in DS versus in euploid samples (DS/Eu) for HSA21 genes (gray) and non-HSA21 genes (yellow) in LCLs (left panel) and fibroblasts (right panel). C, Average DS/Eu expression ratios of 100 HSA21 genes in LCLs (upper panel) and of 106 HSA21 genes in fibroblasts (lower panel). Each dot corresponds to the average of normalized expression values for HSA21 genes according to their order along the chromosome. The range of P values is shown; red indicates lower P values, and black indicates higher P values.
Figure  2.
Figure 2.
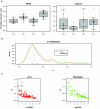
A, Examples of box plots of gene-expression values for two genes, PWP2 and KCNJ15. The Y-axis is normalized expression values; the X-axis is the 62 samples, grouped by cell type (LN = normal LCLs; LD = DS LCLs; FN = normal fibroblasts; FD = DS fibroblasts). The left panel shows an example of a gene with low expression variance (<0.20), and the right panel shows a gene with high expression variance (>1). B, Distribution of CV of gene expression in LCLs (red) (median 0.31) and fibroblasts (green) (median 0.34). C, Regression curve of CVs versus the −logP of the KW test in LCLs (red) and fibroblasts (green), showing an inverse correlation between the CV and the −logP of the KW test.
Figure  3.
Figure 3.
Box plots of normalized expression levels of 91 HSA21 genes expressed in both LCLs and fibroblasts. The Y-axis is normalized expression values, with data points in the range 0–3.5; the X-axis is the four cell/genotype groups (LN = normal LCLs; LD = DS LCLs; FN = normal fibroblasts; FD = DS fibroblasts). Each panel represents a gene (shown on top).
Figure  4.
Figure 4.
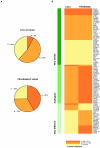
A, Pie charts of D values between the three groups of genes A, B, and C in LCLs and fibroblasts. Group A contains genes with minimal expression overlap between DS and normal samples, group B contains genes with partial overlap, and group C contains genes that show extensive overlap of expression values between DS and control samples. B, Classification of 91 HSA21 genes on the basis of their expression overlap between trisomy 21 and the euploid samples in the two cell types (LCLs and fibroblasts). Each gene is grouped into one of three categories of similarity—“very similar,” “analogous,” and “very different”—on the basis of the similarity of D values between the two cell types.
Figure  5.
Figure 5.
Box plots of normalized expression levels of 9 HSA21 genes expressed only in LCLs and of 15 HSA21 genes expressed only in fibroblasts. Each panel represents a gene (shown on top). The Y-axis is normalized expression values, with data points in the range 0–3.5; the X-axis is the normal (N) and DS samples. The background color indicates the D value from KS tests (see text), and color legend is given at bottom.

References

Web Resources

    1. Coriell Institute for Medical Research, http://www.coriell.org/
    1. Ensembl, http://www.ensembl.org/
    1. HUGO Gene Nomenclature Committee, http://www.gene.ucl.ac.uk/nomenclature/
    1. Online Mendelian Inheritance in Man (OMIM), http://www.ncbi.nlm.nih.gov/Omim/ (for trisomy 21)
    1. The R Project for Statistical Computing, http://www.r-project.org

References

    1. Epstein CJ (ed) (1989) Down syndrome, trisomy 21. In: Scriver CR, Beaudet AL, Sly WS, Valle D, eds. Metabolic basis of inherited disease. McGraw-Hill, New York, pp 291–326
    1. Roizen NJ, Patterson D (2003) Down’s syndrome. Lancet 361:1281–128910.1016/S0140-6736(03)12987-X - DOI - PubMed
    1. Lyle R, Gehrig C, Neergaard-Henrichsen C, Deutsch S, Antonarakis SE (2004) Gene expression from the aneuploid chromosome in a trisomy mouse model of Down syndrome. Genome Res 14:1268–127410.1101/gr.2090904 - DOI - PMC - PubMed
    1. Merla G, Howald C, Henrichsen CN, Lyle R, Wyss C, Zabot MT, Antonarakis SE, Reymond A (2006) Submicroscopic deletion in patients with Williams-Beuren syndrome influences expression levels of the nonhemizygous flanking genes. Am J Hum Genet 79:332–341 - PMC - PubMed
    1. Kahlem P, Sultan M, Herwig R, Steinfath M, Balzereit D, Eppens B, Saran NG, Pletcher MT, South ST, Stetten G, et al (2004) Transcript level alterations reflect gene dosage effects across multiple tissues in a mouse model of Down syndrome. Genome Res 14:1258–126710.1101/gr.1951304 - DOI - PMC - PubMed

Publication types