

Electrophysiological signatures of resting state networks in the human brain
- PMID: 17670949
- PMCID: PMC1941820
- DOI: 10.1073/pnas.0700668104
Electrophysiological signatures of resting state networks in the human brain
Abstract
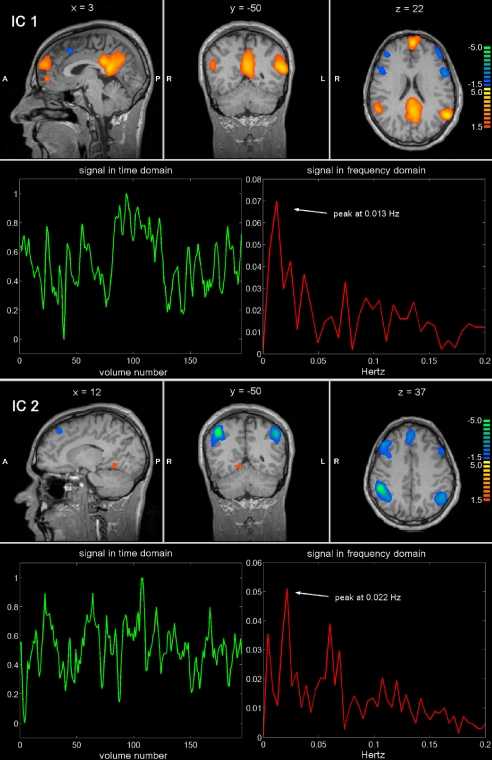
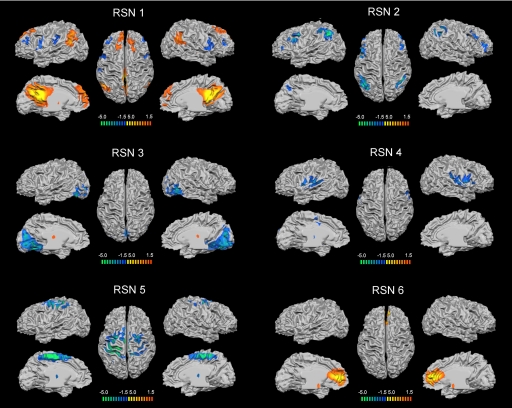
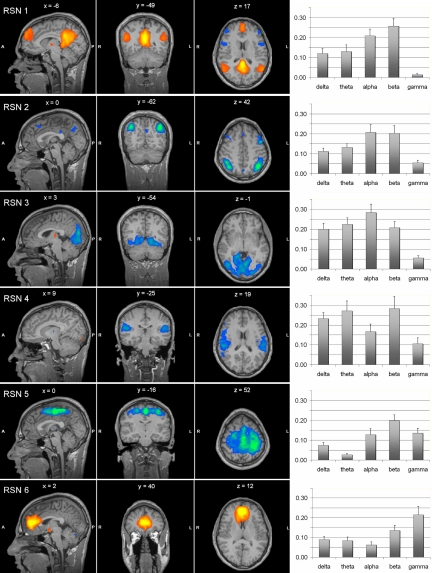
Functional neuroimaging and electrophysiological studies have documented a dynamic baseline of intrinsic (not stimulus- or task-evoked) brain activity during resting wakefulness. This baseline is characterized by slow (<0.1 Hz) fluctuations of functional imaging signals that are topographically organized in discrete brain networks, and by much faster (1-80 Hz) electrical oscillations. To investigate the relationship between hemodynamic and electrical oscillations, we have adopted a completely data-driven approach that combines information from simultaneous electroencephalography (EEG) and functional magnetic resonance imaging (fMRI). Using independent component analysis on the fMRI data, we identified six widely distributed resting state networks. The blood oxygenation level-dependent signal fluctuations associated with each network were correlated with the EEG power variations of delta, theta, alpha, beta, and gamma rhythms. Each functional network was characterized by a specific electrophysiological signature that involved the combination of different brain rhythms. Moreover, the joint EEG/fMRI analysis afforded a finer physiological fractionation of brain networks in the resting human brain. This result supports for the first time in humans the coalescence of several brain rhythms within large-scale brain networks as suggested by biophysical studies.
Conflict of interest statement
The authors declare no conflict of interest.
Figures
References
Publication types
MeSH terms
Substances
Grants and funding
LinkOut - more resources
Full Text Sources
Other Literature Sources
Medical
