Comparative Study
. 2007 Aug 1;27(31):8238-49.
doi: 10.1523/JNEUROSCI.1984-07.2007.

Mitochondrial and plasma membrane potential of cultured cerebellar neurons during glutamate-induced necrosis, apoptosis, and tolerance

Affiliations
Comparative Study

Mitochondrial and plasma membrane potential of cultured cerebellar neurons during glutamate-induced necrosis, apoptosis, and tolerance

Manus W Ward et al. J Neurosci. .

Abstract

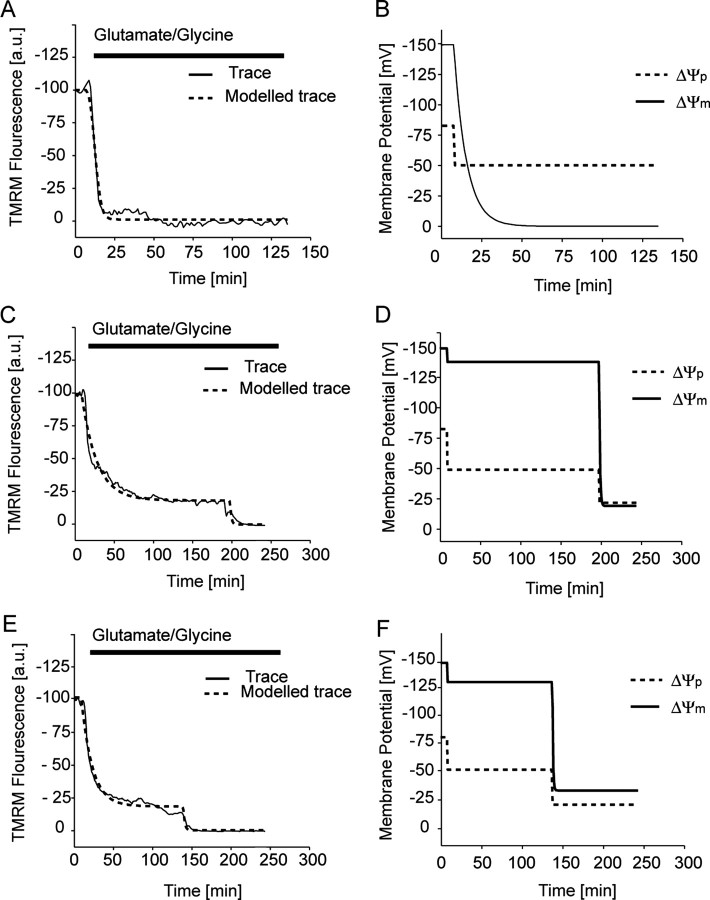
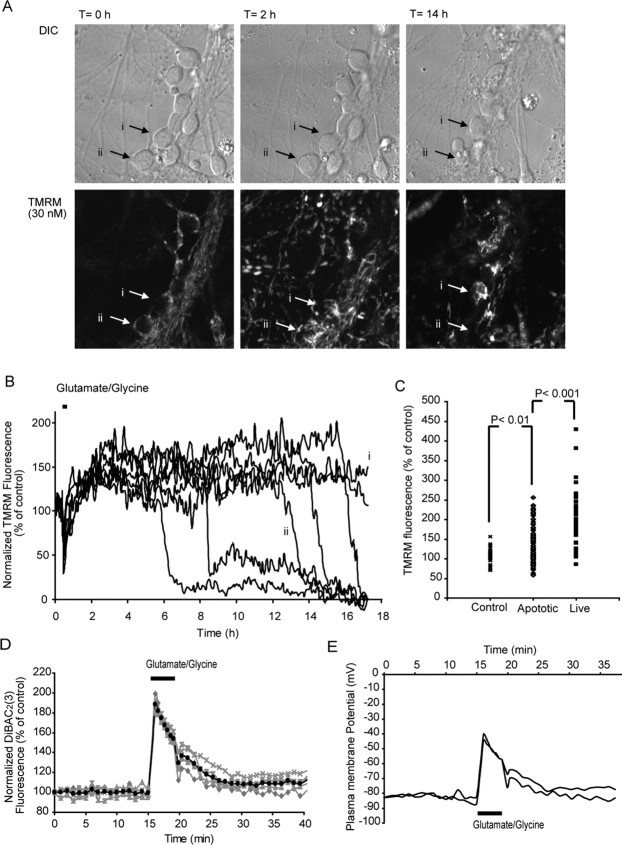
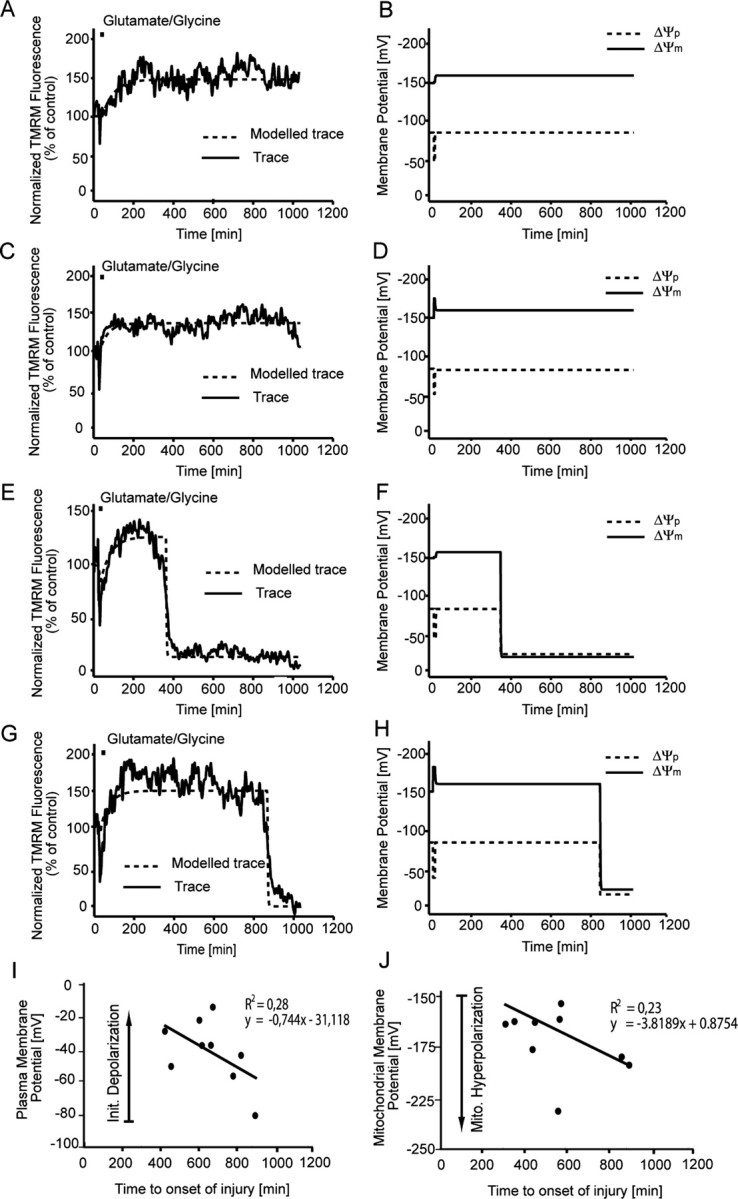
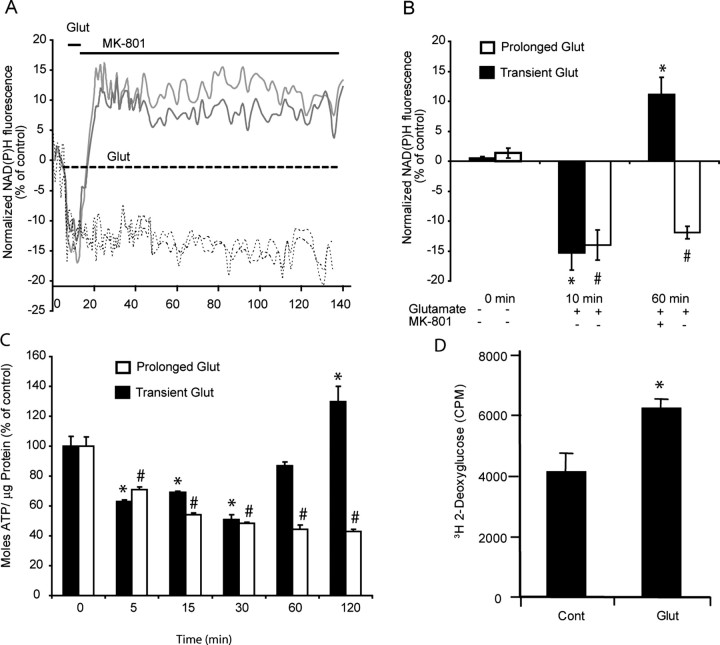
A failure of mitochondrial bioenergetics has been shown to be closely associated with the onset of apoptotic and necrotic neuronal injury. Here, we developed an automated computational model that interprets the single-cell fluorescence for tetramethylrhodamine methyl ester (TMRM) as a consequence of changes in either delta psi(m) or delta psi(p), thus allowing for the characterization of responses for populations of single cells and subsequent statistical analysis. Necrotic injury triggered by prolonged glutamate excitation resulted in a rapid monophasic or biphasic loss of delta psi(m) that was closely associated with a loss of delta psi(p) and a rapid decrease in neuronal NADPH and ATP levels. Delayed apoptotic injury, induced by transient glutamate excitation, resulted in a small, reversible decrease in TMRM fluorescence, followed by a sustained hyperpolarization of delta psi(m) as confirmed using the delta psi(p)-sensitive anionic probe DiBAC2(3). This hyperpolarization of delta psi(m) was closely associated with a significant increase in neuronal glucose uptake, NADPH availability, and ATP levels. Statistical analysis of the changes in delta psi(m) or delta psi(p) at a single-cell level revealed two major correlations; those neurons displaying a more pronounced depolarization of delta psi(p) during the initial phase of glutamate excitation entered apoptosis more rapidly, and neurons that displayed a more pronounced hyperpolarization of delta psi(m) after glutamate excitation survived longer. Indeed, those neurons that were tolerant to transient glutamate excitation (18%) showed the most significant increases in delta psi(m). Our results indicate that a hyperpolarization of delta psi(m) is associated with increased glucose uptake, NADPH availability, and survival responses during excitotoxic injury.


Figures

Figure 1.
Figure 1.
Potential models and fitting parameters for MATLAB-based analysis. The figure depicts the assumed functional behavior of ΔΨm (solid line) and ΔΨp (dashed line) that is used for fitting the TMRM fluorescent responses as taken from biological assumptions described in Materials and Methods. Parameters subject to fitting (potential values, decay constants) are indicated by arrows. A, Potential model for the apoptotic cells showing hyperpolarizion of ΔΨm only (i) and showing hyperpolarization of ΔΨm with a secondary collapse (ii). B, Necrotic model; monophasic response. C, Necrotic model; biphasic response. a.u., Arbitrary units; hyp, hyperpolarizion; max, maximum; dep init, initial depolarization; dep final, final depolarization; inc, increase; dec, decay; Glut, glutamate; DCD, delayed calcium deregulation.
Figure 2.
Figure 2.
Characterization of TMRM fluorescence in cerebellar granule neurons with high-resolution single-cell confocal microscopy. A, Cerebellar granule neurons were loaded with 30 nm TMRM, and the mitochondrial volume (17.6 ± 1.5 μm3; 6.2 ± 0.8%; n = 9) was determined by measuring the volume of individual mitochondria within the neurons after the acquisition of high-resolution z-stacks with an LSM 510 confocal microscope. B, D, Neurons loaded with 100 nm TMRM (B) and 30 nm TMRM (D) were exposed to FCCP (2 μm) in the presence of oligomycin (2 μg/ml) and monitored over a 60 min period. C, E, Using MATLAB software, the traces in B and D were modeled, and the changes in both ΔΨm and ΔΨp were established for these control experiments (all experiments were performed 3 times in different cultures). F, Cerebellar granule neurons were loaded with the ΔΨp-sensitive probe DiBAC2(3) (1 μm) and exposed to oligomycin (2 μg/ml), followed by FCCP (2 μm). A rapid increase in fluorescence (depolarization of ΔΨp) was associated with the addition of FCCP (traces are representative of those obtained from 3 separate experiments). G, Representative traces for modeled changes in ΔΨp (A) for neurons exposed to oligomycin (2 μg/ml) and FCCP (2 μm). Oligo, Oligomycin.
Figure 3.
Figure 3.
Protonophore addition induces a rapid collapse of Ca2+ homeostasis that is blocked with MK-801. A, B, Neurons were loaded with TMRM (30 nm) and Fluo-4 (3 μm) for 30 min at 37°C and exposed to FCCP (2 μm) in the presence of oligomycin (2 μg/ml) with (A) or without (B) MK-801 (10 μm). A rapid increase in cytosolic Ca2+ accompanied the FCCP addition in neurons that did not have MK-801 present (experiments were repeated 3 times for each condition, with similar results). C, Neurons were treated with a combination of FCCP (2 μm), oligomycin (2 μg/ml), and MK-801 (10 μm) for 30 min, and ATP levels were measured moles ATP/μg protein. All data were normalized to control values for comparison between experiments (experiments were performed in triplicate in 3 separate cultures;**p < 0.001; *p < 0.01 difference from control). Error bars indicate SEM. Oligo, Oligomycin; Arb units, arbitrary units.
Figure 4.
Figure 4.
Prolonged glutamate excitation induces a rapid loss of ΔΨm and early necrotic injury in cerebellar granule neurons. Cerebellar granule neurons plated on Willco dishes were loaded with 30 nm TMRM and continuously exposed to glutamate/glycine (100 μm/10 μm). TMRM fluorescence was then monitored over time, and images were taken at 1 min intervals. A, Differential interference contrast (DIC) and TMRM fluorescent images were chosen at selected time points (0, 30, and 120 min during glutamate excitation) from a representative experiment. B, Representative traces for whole-cell TMRM fluorescence in neurons during prolonged glutamate excitation. Two major subgroups were identified: traces that show a rapid collapse of ΔΨm (i) and traces that show a partial recovery of ΔΨm, followed by a secondary collapse of ΔΨm (ii). C, Whole-cell TMRM fluorescence in control neurons after 30 min and neurons treated with glutamate for 30 min. p < 0.001, difference between TMRM fluorescence for control neurons and neurons after 30 min continuous glutamate excitation (control, n = 39; necrotic, n = 63). D, Cerebellar granule neurons were loaded with the ΔΨp-sensitive probe DiBAC2(3) (1 μm) and continuously exposed to glutamate/glycine (100 μm/10 μm). Neurons undergo a rapid monophasic (i) collapse of ΔΨp or a biphasic (ii) collapse of ΔΨp (traces are representative of those obtained from 3 separate experiments). E, Representative traces for modeled changes in ΔΨp (C) for neurons undergoing a rapid monophasic (i) collapse of ΔΨp or a biphasic (ii) collapse of ΔΨp when continuously exposed to glutamate/glycine (100 μm/10 μm).
Figure 5.
Figure 5.
Computational modeling of TMRM traces for neurons during prolonged glutamate excitation. Cerebellar granule neurons plated on Willco dishes were loaded with 30 nm TMRM and continuously exposed to glutamate/glycine (100 μm/10 μm). TMRM fluorescence was then monitored over time, and images were taken at 2 min intervals. A, Representative TMRM fluorescent trace (solid line) and fitted trace (dashed line) for a neuron that had a rapid monophasic response during glutamate induced necrosis. C, E, Representative TMRM fluorescent traces and fitted traces for neurons that have a biphasic response during glutamate-induced necrosis. B, D, F, Modeled changes in both ΔΨp (dashed lines) and ΔΨm (solid line) for the fitted traces in figures A, C, and E, respectively. TMRM (A, C, E) traces are representative of traces obtained from eight separate experiments from different cultures. a.u., Arbitrary units.
Figure 6.
Figure 6.
Transient glutamate excitation results in a hyperpolarization ΔΨm and a late apoptotic injury in cerebellar granule neurons. Cerebellar granule neurons plated on Willco dishes were loaded with 30 nm TMRM and exposed to glutamate/glycine (100 μm/10 μm) for 5 min. TMRM fluorescence was then monitored over time, and images were taken at 5 min intervals. A, Differential interference contrast (DIC) and TMRM fluorescent images were chosen at selected time points (0 min, 2 h, and 14 h after glutamate) from a representative experiment. B, Representative traces for whole-cell TMRM fluorescence in neurons during prolonged glutamate excitation. Two major subgroups are shown: traces that show a secondary collapse of ΔΨm downstream of excitation (i) and traces that show a collapse of ΔΨm within 24 h (ii). C, Whole-cell TMRM fluorescence in control neurons after 120 min and neurons 120 min after glutamate excitation. p < 0.01, difference between TMRM fluorescence for control neurons and apoptotic neurons 120 min after transient glutamate excitation; p < 0.001 difference between TMRM fluorescence for apoptotic neurons 120 min after transient excitation compared with neurons that survive for >24 h after glutamate excitation (control, n = 39; apoptotic, n = 134; live, n = 31). D, Cerebellar granule neurons were loaded with the ΔΨp-sensitive probe DiBAC2(3) (1 μm) and transiently (5 min) exposed to glutamate/glycine (100 μm/10 μm). Fluorescence recovers close to pre-exposure levels (average response dark trace) after the addition of glutamate (traces are representative of those obtained from 3 separate experiments). E, Representative traces for modeled changes in ΔΨp for neurons transiently exposed to glutamate.
Figure 7.
Figure 7.
Computational modeling of TMRM traces for cerebellar granule neurons after transient glutamate excitation. Cerebellar granule neurons plated on Willco dishes were loaded with 30 nm TMRM and exposed to glutamate/glycine (100 μm/10 μm) for 5 min. TMRM fluorescence was then monitored over time, and images were taken at 5 min intervals. A, C, Representative TMRM fluorescent traces (solid line) and fitted traces (dashed lines) for neurons that undergo apoptosis after transient glutamate excitation. E, G, Representative TMRM fluorescent traces and fitted traces for neurons that do not undergo apoptosis after transient glutamate excitation. B, D, F, H, Modeled changes in both ΔΨp (dashed lines) and ΔΨm (solid line) for the fitted traces in A, C, E, and F, respectively. TMRM traces (A, C, E, G) are representative of traces obtained from eight separate experiments from different cultures. I, The fitted initial depolarization of ΔΨp during glutamate excitation is plotted against the onset of injury (collapse of TMRM signal; n = 5 populations of neurons). J, The fitted maximum mitochondrial hyperpolarization of ΔΨm against onset of injury after glutamate excitation (n = 5 populations of neurons).
Figure 8.
Figure 8.
Glutamate (Glut) induced changes in neuronal NADPH, ATP, and glucose uptake. Cerebellar granule neurons plated on Willco dishes were exposed to glutamate/glycine (100 μm/10 μm) continuously (dashed line) or for 5 min (solid line) before termination of NMDA receptor activation with MK-801 (10 μm). A, B, NADPH autofluorescence was monitored over time (A) and at selected time points (0, 10, and 60 min; B) chosen before, during, and after glutamate excitation for statistical analysis. (At least 5 cells were analyzed per experiment, and the experiment was repeated in three different cultures. #p < 0.01; *p < 0.01, difference from respective control.) C, Cerebellar granule neurons plated in 24-well plates were exposed to glutamate/glycine (100 μm/10 μm) for 5 min or continuously, and their ATP content was measured (moles ATP/μg protein) at the times indicated. Data are represented as percentage of control response (n = 3 experiments in triplicate; #p < 0.01; *p < 0.01, difference from respective control). D, Cerebellar granule neurons plated in 96-well plates were exposed to glutamate/glycine (100 μm/10 μm) for 10 min and washed, and the medium was replaced with buffer containing 3H-2-deoxyglucose for 20 min. The cells were washed twice, and the 3H-2-deoxyglucose was measured in a Matrix-96 beta counter for 20 min. Data are presented as counts per minute (CPM) for control (washed neurons) and glutamate-treated neurons (6 wells were examined per condition per experiment and repeated in 3 separate cultures; *p < 0.01). Error bars indicate SEM.

Similar articles

Cited by

References

    1. Aarts M, Iihara K, Wei WL, Xiong ZG, Arundine M, Cerwinski W, MacDonald JF, Tymianski M. A key role for TRPM7 channels in anoxic neuronal death. Cell. 2003;115:863–877. - PubMed
    1. Almeida A, Heales SJ, Bolanos JP, Medina JM. Glutamate neurotoxicity is associated with nitric oxide-mediated mitochondrial dysfunction and glutathione depletion. Brain Res. 1998;790:209–216. - PubMed
    1. Ankarcrona M, Dypbukt JM, Bonfoco E, Zhivotovsky B, Orrenius S, Lipton SA, Nicotera P. Glutamate-induced neuronal death: a succession of necrosis or apoptosis depending on mitochondrial function. Neuron. 1995;15:961–973. - PubMed
    1. Atlante A, Gagliardi S, Minervini GM, Marra E, Passarella S, Calissano P. Rapid uncoupling of oxidative phosphorylation accompanies glutamate toxicity in rat cerebellar granule cells. NeuroReport. 1996;7:2519–2523. - PubMed
    1. Bano D, Young KW, Guerin CJ, Lefeuvre R, Rothwell NJ, Naldini L, Rizzuto R, Carafoli E, Nicotera P. Cleavage of the plasma membrane Na+/Ca2+ exchanger in excitotoxicity. Cell. 2005;120:275–285. - PubMed

Publication types

MeSH terms