Comparative Study
. 2007 Aug 1;27(31):8261-7.
doi: 10.1523/JNEUROSCI.0754-07.2007.

Human MST but not MT responds to tactile stimulation

Affiliations
Comparative Study

Human MST but not MT responds to tactile stimulation

Michael S Beauchamp et al. J Neurosci. .

Abstract

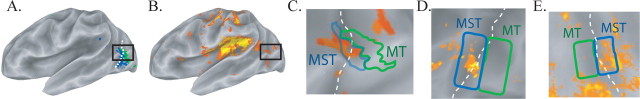
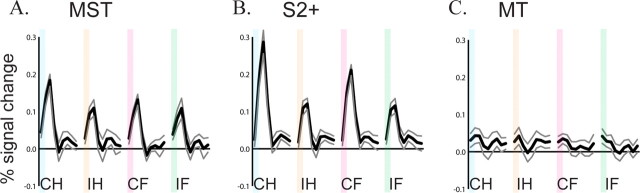
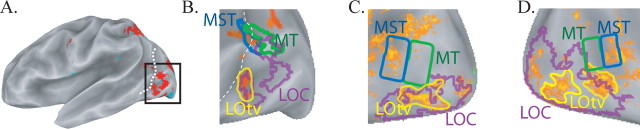
Previous reports of tactile responses in human visual area MT/V5 have used complex stimuli, such as a brush stroking the arm. These complex moving stimuli are likely to induce imagery of visual motion, which is known to be a powerful activator of MT. The area described as "MT" in previous reports consists of at least two distinct cortical areas, MT and MST. Using functional magnetic resonance imaging, we separately localized human MT and MST and measured their response to vibrotactile stimuli unlikely to induce imagery of visual motion. Strong vibrotactile responses were observed in MST but not in MT. Vibrotactile responses in MST were approximately one-half as large as the response to visual motion and were distinct from those in another visual area previously reported to respond to tactile stimulation, the lateral occipital complex. To examine somatotopic organization, we separately stimulated the left and right hand and foot. No spatial segregation between hand and foot responses was observed in MST. The average response profile of MST was similar to that of somatosensory cortex, with a strong preference for the contralateral hand. These results offer evidence for the existence of somatosensory responses in MST, but not MT, independent of imagery of visual motion.


Figures

Figure 1.
Figure 1.
BOLD responses to visual and tactile stimulation (A–C, single subject; D–E, group data). A, Lateral view of the partially inflated left hemisphere. Brain areas responsive to visual motion that showed a response to ipsilateral stimulation (MST; blue) or no response to ipsilateral stimulation (MT; green) are shown. Dashed white line shows the fundus of the ascending limb of the posterior inferior temporal sulcus. B, Brain areas in the same subject responding to vibrotactile stimulation (orange-to-yellow color scale). C, Composite map showing MST (blue outline) and MT (green outline) overlaid on tactile activation map (enlarged view of black outlined region in A and B). D, Random-effects group average map (n = 8 subjects) showing location of MST and MT relative to tactile activation in left hemisphere (anterior is left). E, Group average composite map for right hemisphere (anterior is right).
Figure 2.
Figure 2.
Time course of average evoked BOLD response (n = 8 subjects) to vibrotactile stimulation in MST (A), S2+ (B), and MT (C). Plots show evoked response to contralateral hand (CH), ipsilateral hand (IH), contralateral foot (CF), and ipsilateral foot (IF) stimulation. Colored bars illustrate 2 s stimulus duration. Black lines show mean signal change for 16 s after stimulus onset, and gray lines show ±1 SEM.
Figure 3.
Figure 3.
Relationship between tactile responses in MST and LOC (A, B, single subject; C, D, group data). A, Brain regions, in red, showing greater response to real pictures compared with scrambled controls in a single-subject left hemisphere. Dashed white line shows the fundus of the ascending limb of the posterior inferior temporal sulcus. B, Enlarged view of posterior lateral cortex (black region outlined in A). Shown is a composite map of LOC (outlined in purple), MST (blue), and MT (green) overlaid on tactile responses (orange). Portions of LOC, labeled as LOtv and outlined in yellow, responded to tactile stimulation. C, Group composite map showing identified visual areas overlaid on tactile activation in the left hemisphere (anterior is left). D, Group composite map of right hemisphere (anterior is right).
Figure 4.
Figure 4.
Location of hand- and foot-preferring regions (A–C, single subject; D–F, group data). A, Lateral view of right hemisphere. The color scale shows regions with a significant response to tactile stimulation and a preference for contralateral (left) foot stimulation (blue color scale), contralateral (left) hand stimulation (orange color scale), or no preference (green). The same color scale is used for A–F. B, Enlarged view of posterior lateral cortex (black region outlined in A). C, Enlarged view of operculum (white region outlined in A). A mirror-symmetric organization of foot- and hand-responsive areas was observed. D, Lateral view of group average dataset. E, Enlarged view of posterior cortex. F, Enlarged view of operculum.
Figure 5.
Figure 5.
Group map of cortical tactile activations with spatial smoothing (8 mm full-width half-maximum Gaussian kernel). A, Lateral view of left hemisphere. B, Medial view of left hemisphere. C, Superior view of both hemispheres. D, Lateral view of right hemisphere. E, Medial view of right hemisphere. Outline shows selected regions. SMA, Supplementary motor area, located in the medial superior frontal cortex. Light green dashed line shows the fundus of the central sulcus, and dark green dashed line shows the fundus of the postcentral sulcus.
Figure 6.
Figure 6.
A, Brain areas responsive to visual motion that showed a response to ipsilateral visual stimulation (MST; blue) or no response to ipsilateral stimulation (MT; green) in a control subject (enlarged view of posterior left hemisphere). B, Composite map showing location of area MST and MT in the same subject overlaid on tactile activation map for an experiment in which all stimuli were delivered to the contralateral (right) hand. C, Results of a separate control experiment comparing responses to somatosensory and visual stimulation. Shown is an average time series from MST in a single subject for contralateral hand and ipsilateral hand (CH and IH, respectively) and foot (CF and IF, respectively) stimulation and for an average of six types of visual stimulation consisting of moving point-light figures (VIS).
Figure 7.
Figure 7.
Relationship between cytoarchitectonically defined areas and somatosensory vibrotactile activation. A, Cytoarchitectonic regions in and near S1 from the Anatomy Toolbox (z = 54 mm) (Geyer et al., 1999; Grefkes et al., 2001; Eickhoff et al., 2005). B, Average somatosensory activation (orange-to-yellow color scale) under cytoarchitectonic boundaries (colored outlines). C, Cytoarchitectonic regions in and near S2 (z = 18 mm) (Eickhoff et al., 2006a,b). D, Average somatosensory activations under cytoarchitectonic boundaries.

Similar articles

Cited by

References

    1. Amedi A, Malach R, Hendler T, Peled S, Zohary E. Visuo-haptic object-related activation in the ventral visual pathway. Nat Neurosci. 2001;4:324–330. - PubMed
    1. Amedi A, Jacobson G, Hendler T, Malach R, Zohary E. Convergence of visual and tactile shape processing in the human lateral occipital complex. Cereb Cortex. 2002;12:1202–1212. - PubMed
    1. Argall BD, Saad ZS, Beauchamp MS. Simplified intersubject averaging on the cortical surface using SUMA. Hum Brain Mapp. 2006;27:14–27. - PMC - PubMed
    1. Beauchamp MS. Statistical criteria in FMRI studies of multisensory integration. Neuroinformatics. 2005;3:93–114. - PMC - PubMed
    1. Beauchamp MS, Cox RW, DeYoe EA. Graded effects of spatial and featural attention on human area MT and associated motion processing areas. J Neurophysiol. 1997;77:516–520. - PubMed

Publication types

LinkOut - more resources