Comparative Study
. 2007 Aug 1;27(31):8344-57.
doi: 10.1523/JNEUROSCI.2399-07.2007.

Desensitization properties of AMPA receptors at the cerebellar mossy fiber granule cell synapse

Affiliations
Comparative Study

Desensitization properties of AMPA receptors at the cerebellar mossy fiber granule cell synapse

David A DiGregorio et al. J Neurosci. .

Abstract

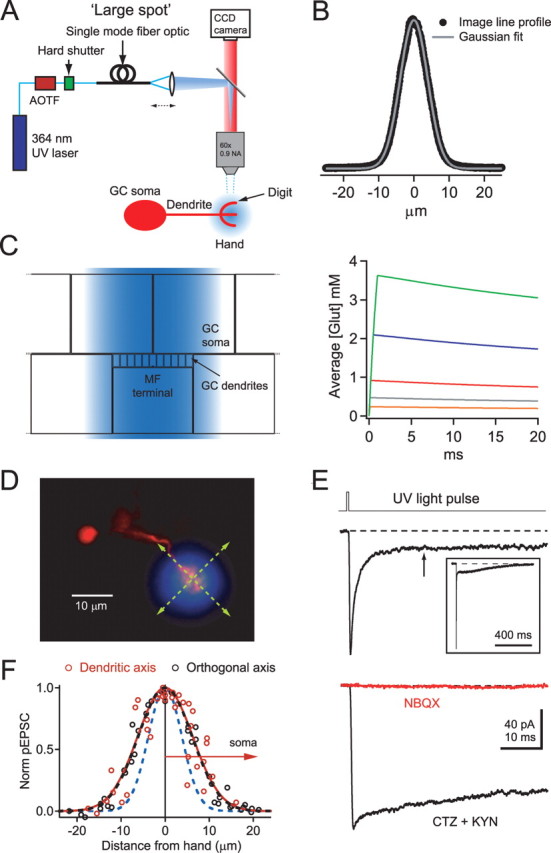
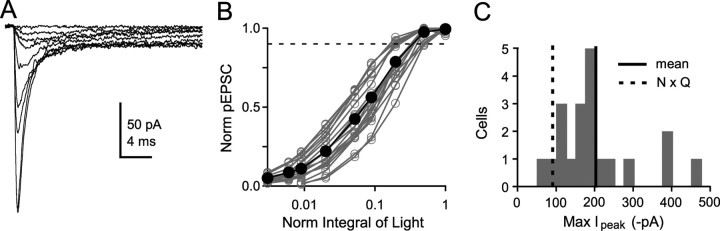
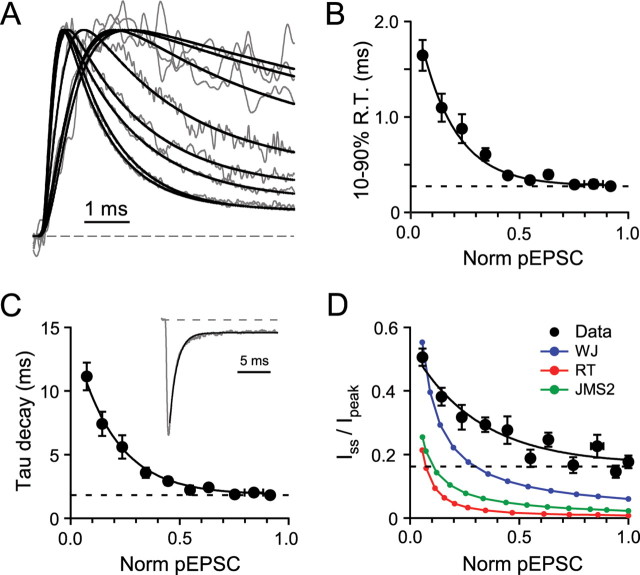
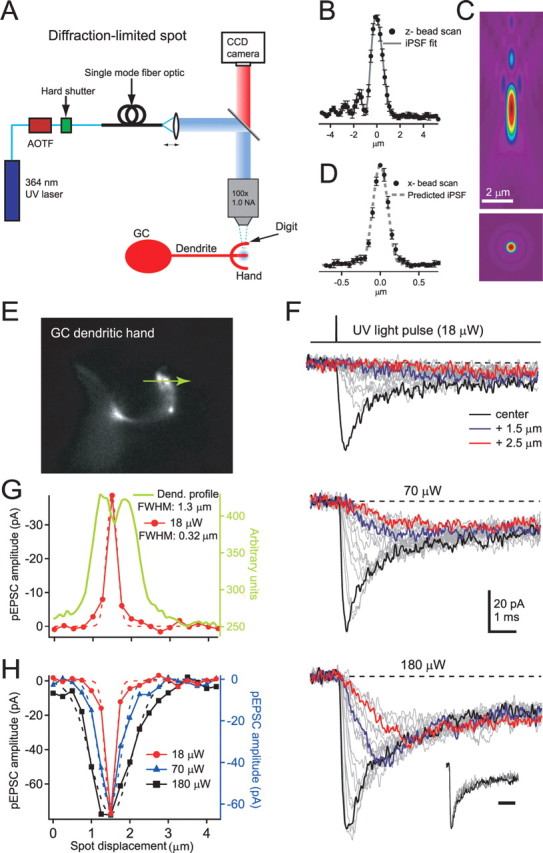
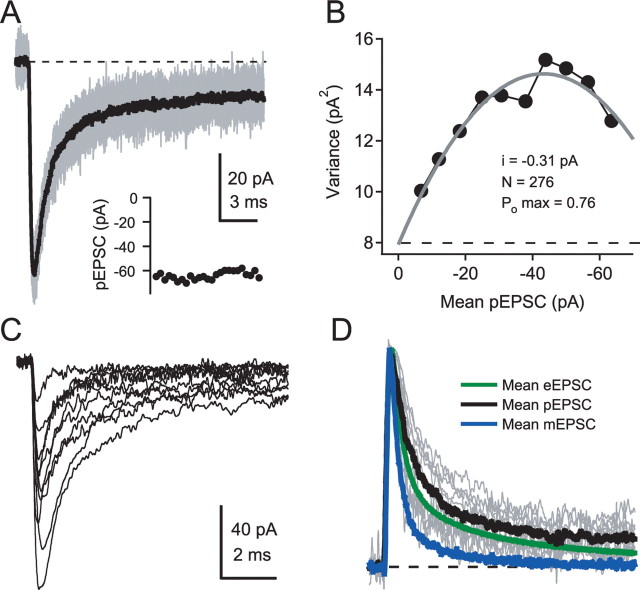
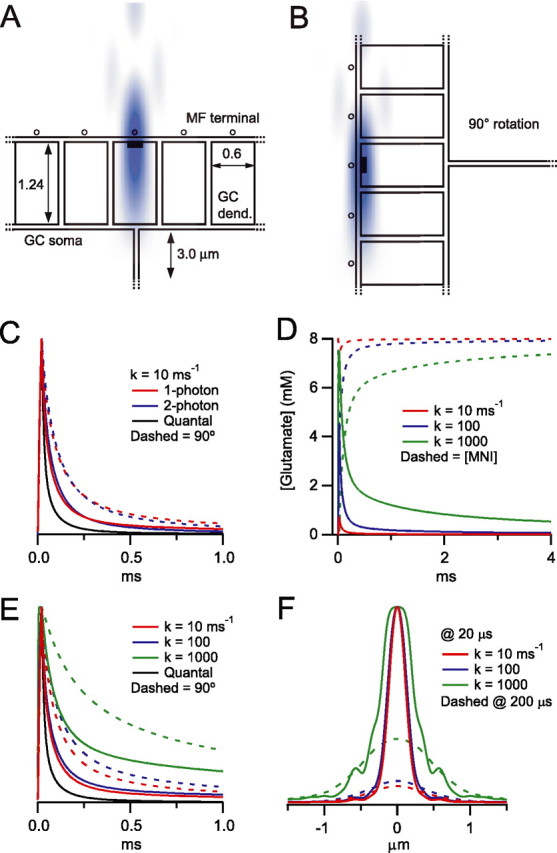
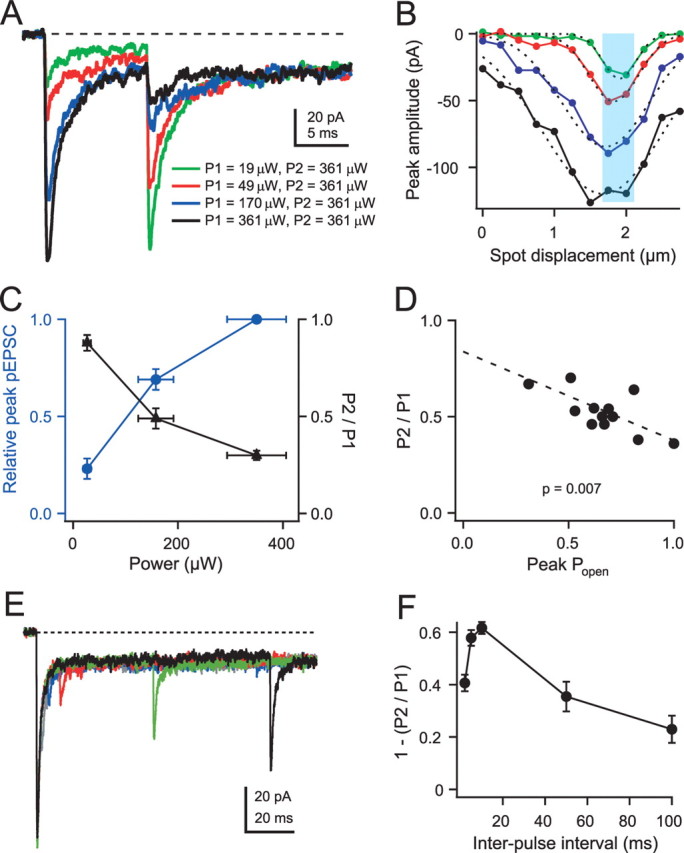
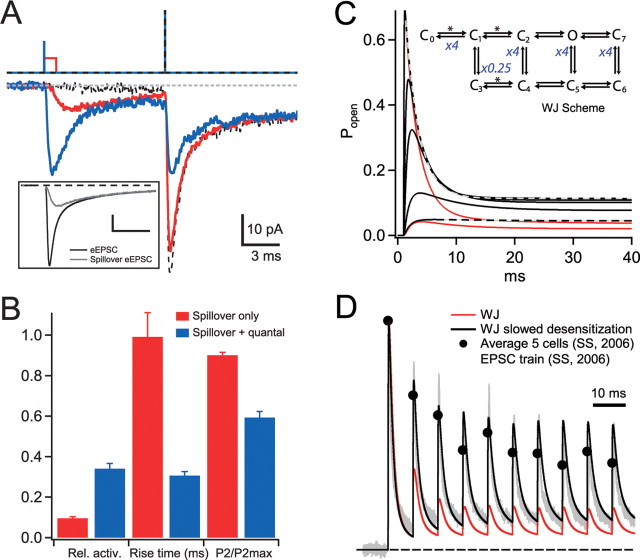
Native AMPA receptors (AMPARs) exhibit rapid and profound desensitization in the sustained presence of glutamate. Desensitization therefore contributes to short-term depression at synapses in which glutamate accumulates. At synapses that do not exhibit desensitization-dependent depression, AMPARs are thought to be protected against prolonged or repetitive exposure to synaptically released glutamate. At the cerebellar mossy fiber to granule cell (GC) synapse, in which high release probability and glutamate spillover produce a substantial buildup of glutamate concentration in the cleft ([Glut]cleft) during high-frequency transmission, only moderate desensitization of the phasic AMPAR EPSC occurs. To investigate how such currents are produced, we examined the kinetic properties of synaptic AMPARs in GCs using glutamate uncaging. Photolysis of 4-methoxy-7-nitroindolinyl-caged L-glutamate with large illumination spots produced step-like increases in [Glut]cleft that could be used to systematically probe AMPAR kinetics. At low levels of activation, synaptic AMPARs exhibited little desensitization. With larger activations, the desensitization time course became faster, but the level of desensitization was only weakly dependent on receptor occupancy. Indeed, a substantial desensitization-resistant current component remained (17%) in saturating glutamate. Photolysis with small illumination spots produced brief [Glut]cleft waveforms and transient AMPAR activations, similar to the EPSC current components. Paired-pulse uncaging with such spots revealed little desensitization after spillover-like activations and modest depression after activations that mimicked quantal and spillover components together. Our results show that GC AMPARs exhibit a resistance to desensitization at low occupancies and that this property is crucial for sustaining high-frequency transmission at a synapse in which glutamate accumulates.


Figures

Figure 1.
Figure 1.
Glutamate uncaging with a large UV illumination spot produces step-like glutamate concentration changes. A, Simplified optical configurations for the large UV illumination spot with a diagram of a GC soma, dendrite, “hand,” and “digit.” A large collimated illumination spot was generated by coupling a UV laser beam into a single-mode fiber optic whose output was focused at the back aperture of the objective. B, Intensity profile for the large UV spot measured from a CCD image of fluorescence produced by illuminating a monolayer of beads. The gray trace shows a fit to a Gaussian function. C, Schematic diagram showing an x–z cross section through part of the extended diffusional space and large-spot illumination profile (blue) used for large-spot uncaging simulations. Right is simulated [Glut]cleft transients produced by large-spot illumination for various uncaging durations and intensities (0.1 ms for an uncaging rate k = 0.37 ms−1, and 0.1–1 ms for k = 0.73 ms−1). Traces represent spatial averages over the glomerulus calculated from five PSD measurements at equal distances from the center to the edge and their corresponding radial areas (200-nm-wide rings). D, Fluorescence image of the soma and dendrite of a GC with a semitransparent image of the large UV spot superimposed. Green lines illustrate scan directions in F. E, pEPSC evoked using the large UV spot and 0.5 ms pulse duration. Inset shows full pEPSC from a different cell on a longer timescale. Arrow indicates the 18 ms point. The bottom traces are current responses in the presence of 100 μm CTZ and 2 mm KYN (black), followed by the addition of 100 μm NBQX (red). F, Normalized current amplitudes evoked with the large UV spot at different locations along dendritic axis (red symbols, arrow indicates direction toward soma) or orthogonal to dendritic axis (black symbols). Gaussian fits gave FWHMs of 14.7 and 14.4 μm for the dendritic and orthogonal axis, respectively. Blue dashed line shows a Gaussian fit to large UV spot illumination profile (B).
Figure 2.
Figure 2.
Response of synaptic AMPARs to large-spot illumination at various light intensities. A, Averaged (4 traces) large-spot pEPSCs in response to increasing UV illumination. The intensity of a 0.1 ms pulse was increased to its maximum, after which the duration was increased to 0.2, 0.5, and 1.0 ms. B, Relationship between the relative peak amplitude of pEPSCs and normalized integral of light (n = 20). Dashed line denotes 90% criteria for achieving a saturating response. C, Histogram of maximum peak currents of saturated responses for 20 cells. Thick black line denotes the mean maximal amplitude of the pEPSC of all cells, and the dashed black line indicates the population average maximal synaptic output [mean number of release sites multiplied by average quantal current, N × Q (taken from Sargent et al., 2005)]. Data have been corrected for series resistance voltage errors.
Figure 3.
Figure 3.
Kinetic properties of synaptic AMPARs at various receptor occupancies. A, Normalized traces from Figure 2A and their fit to an empirical rising and decaying function (Eq. 1). B, Relationship between 10–90% rise time (R.T.) of the pEPSCs and fraction of saturated current for each cell (Norm pEPSC; n = 20). Only pEPSCs activated with brief illumination durations were used (≤200 μs; x and y error bars indicate SEM). The solid line is an exponential fit using a floating offset. Dashed line indicates the limiting value (i.e., the last value corresponding to the last data point). C, Relationship between the decay time constant of pEPSC and normalized pEPSC activated with brief illumination pulses (≤200 μs; n = 20). Solid line is a single-exponential fit to the data points, and the dashed line shows the limiting decay time constant. Inset shows an example of a single-exponential fit (black) to the decay of a large-spot pEPSC. D, Relationship between the fractional steady-state current (Iss/Ipeak) at 18 ms after the light pulse (filled circles) and the peak amplitude of the normalized pEPSCs (n = 16). The solid line is an exponential fit to the data. The long dashed line shows the limiting value of Iss/Ipeak calculated from the last two 18 ms points. Color symbols represent the Iss/Ipeak measured at 10 times decay time constant for the three native AMPAR model simulations in response to step changes in [Glut]. WJ is Wadiche and Jahr (Wadiche and Jahr, 2001), RT is Raman and Trussel (Raman and Trussell, 1995), and JMS2 is Jonas, Major, and Sakmann scheme 2 (Jonas et al., 1993). For these simulations [Glut] values were adjusted to reproduce the range of fractional activation of the GC experimental data.
Figure 4.
Figure 4.
Spatial dependence of small-spot pEPSCs on granule cell dendritic hands. A, Optical configuration used to form a small diffraction-limited UV illumination spot. The small spot was generated by collimating the light emitted from the optical fiber so that it formed a parallel beam with a Gaussian profile that filled the back aperture of the microscope objective. B, Averaged fluorescence emitted by 110 nm fluorescent beads as a function of axial distance (200 nm steps) when illuminated with a small UV spot (n = 5; filled circles). Gray line shows the fit of the theoretical iPSF including spherical aberrations. C, x–z (top) and x–y (bottom) intensity profile of the theoretical 3D iPSF determined from fit of the data in B. D, Averaged fluorescence intensity distribution of a laterally scanned 110 nm bead (50 nm steps; n = 5; filled circles). Dashed line shows the predicted x-line profile of the fitted iPSF from B. E, Image of a GC dendritic hand visualized with Alexa 594. The green arrow indicates the length (4 μm) and location over which uncaging responses were elicited. F, pEPSCs evoked with a brief (20 μs) diffraction-limited UV illumination spot during local perfusion of 10 mm MNI-glutamate at three different light intensities elicited at different locations (250 nm apart) across the dendritic hand shown in E (photolysis scan). Thick black traces show fastest-rising responses. Inset shows normalized pEPSCs, for each of the three laser intensities, recorded from the location in which the fast-rising current was measured. Inset calibration bar is 2 ms. G, Current amplitudes for the lowest intensity (18 μW) measured at the time the largest current peaked (filled red circles) plotted as a function of distance. Dashed line indicates a Gaussian fit. Green line shows the intensity line profile from the CCD image indicating the location of the dendritic structure (E) from which the pEPSCs were recorded. H, Plot of amplitude at the time that the largest current peaked as a function of distance with Gaussian fits for the two highest intensities together with scaled data from G (red).
Figure 5.
Figure 5.
Peak open probability and time course of AMPAR-mediated pEPSCs evoked with small-spot illumination. A, Twenty-five consecutive pEPSCs (gray traces) and their mean (black trace) evoked with a brief high-intensity diffraction-limited spot at the location that gave the largest amplitude and fastest rise time. Inset, The peak amplitude of the pEPSCs plotted in order of acquisition from left to right. B, Relationship between variance and mean current for pEPSC decay calculated from traces in A using pairwise nonstationary fluctuation analysis (see Materials and Methods). Gray trace is a binomial fit, and dashed line indicates background variance. The mean number of channels across cells was 215 ± 36 (n = 24). C, Maximal pEPSCs evoked with brief, high-intensity small-spot illumination from 10 cells, which had fast rise times and unimodal spatial dependence. The light intensities ranged from 160 to 480 μW. D, Normalized traces from C (gray traces) with their population mean (black trace), the population mean of action potential-evoked EPSCs [eEPSC, green trace (taken from DiGregorio et al., 2002)], and the population mean quantal current [mEPSC, blue trace (taken from Nielsen et al., 2004)].
Figure 6.
Figure 6.
Numerical simulations of single-photon and two-photon diffraction-limited uncaging within a simplified 3D MF–GC structure. A, Cross section (x–z plane) of part of the MF–GC diffusional space and the superimposed small diffraction-limited UV iPSF (blue) used for small-spot simulations. Glutamate uncaging and diffusion occurred in the space between dendritic digits, GC soma, and the MFs (20 nm wide). Black rectangle indicates 200 nm PSD. Open circles represent MF synaptic vesicles. B, Diffusional space rotated by 90° with respect to the iPSF used to estimate the extreme condition when the long axis of iPSF is parallel to the synaptic cleft. C, Simulated photolysis-evoked [Glut]cleft transients for a brief illumination pulse (20 μs) using the measured one-photon iPSF (from Fig. 4B; red) and a simulated two-photon excitation volume (blue). The two-photon excitation volume was approximated by a 3D Gaussian function with lateral and axial dimensions corresponding to the minimum theoretical values for 720 nm light (FWHMs of 276 and 995 nm; NA 1.0) (Zipfel et al., 2003). Solid traces are simulations when the iPSF orientation is as in A, and dashed lines are when the iPSF is rotated 90° as in B. The black trace is the simulated quantal [Glut]cleft decay waveform arising from the instantaneous release of 4000 glutamate molecules (Nielsen et al., 2004) aligned to start at the end of the illumination pulse. All traces are normalized to their peak values. D, Simulated one-photon iPSF photolysis-evoked [Glut]cleft transients (solid lines) and [MNI-glutamate]cleft (dashed lines) for three different uncaging rate constants (k), using a 20 μs uncaging duration. E, Peak normalized simulated [Glut]cleft transients from D (solid lines) and simulations for the 90° rotation (dashed lines). Black trace is the simulated quantal [Glut]cleft time course as in C. F, Spatial profile of the [Glut] at the end of a 20 μs uncaging pulse for the upright spot orientation and different values of k (FWHM of 0.27, 0.30, and 0.49 μm for increasing uncaging rates, respectively). Dashed lines are the predicted spatial profiles at 200 μs after the start of the uncaging pulse, which are scaled to their corresponding peak amplitude at 20 μs (the color code is preserved; 0.90, 0.94, and 1.15 μm for increasing uncaging rates, respectively).
Figure 7.
Figure 7.
Desensitization properties after transient AMPAR activation using paired-pulse small-spot UV photolysis. A, pEPSCs in response to pairs of 20 μs small-spot illumination pulses using a 10 ms interval. Light intensity of the first pulse (P1) was varied, whereas the intensity of the second pulse (P2) was maintained at the highest (saturating) intensity of the first pulse. B, Amplitudes of small-spot pEPSC responses at different distances for P1 across a dendritic digit in same region as A. Color coding indicates different light intensities as for P1 in A. Dotted lines show Gaussian fits with FWHMs of 0.55, 0.82, 1.44, and 2.00 μm (for green to black P1 intensity). Cyan region shows region over which traces in A were collected and averaged. C, Relationships between fractional activation of the first pulse (blue circles) or P2/P1 pEPSC amplitude ratio (black triangles) and light intensity. Mean P2/P1 amplitude ratios were 0.88 ± 0.04 (n = 6), 0.49 ± 0.05 (n = 6), and 0.30 ± 0.02 (n = 7) for low, medium, high light levels, respectively. D, Relationship between P2/P1 pEPSC amplitude ratio and channel open probability (Popen) for 13 cells. Dashed line shows linear regression fit with right-hand intercept of 0.38 for a Popen = 1. E, High-intensity paired-pulse pEPSC responses for various interpulse intervals (2 ms, gray; 5 ms, blue; 10 ms, red; 50 ms, green; 100 ms, black). F, Relationship between 1 − (P2/P1), which indicates the fraction of desensitization, and interpulse interval for 10 cells.
Figure 8.
Figure 8.
Weak desensitization of pEPSCs at low receptor occupancies. A, pEPSCs in response to a 10 ms paired-pulse protocol (top traces), in which P1 intensity was set to a low and long duration to mimic activation by glutamate spillover alone (<1 μW, 1 ms; red traces) or a brief intermediate intensity to mimic the quantal and spillover current components together (20 μs, 15–30 μW; blue traces). P2 was set to a brief high intensity. A maximal pEPSC response to P2 was obtained when P1 was omitted (dashed line). For comparison, the inset shows the overall mean AMPAR-mediated synaptic eEPSC and the spillover-mediated eEPSC taken from DiGregorio et al. (2002). Calibration: 10 pA, 3 ms. B, Summary plot for five cells, showing fractional pEPSC activation (Rel. active.), 10–90% rise time, and fractional activation of P2 (P2/P2max) for quantal-plus-spillover and spillover-only pEPSC responses. In these experiments, when P1 and P2 were both maximal, P2/P1 was 0.31 ± 0.02, indicating a near saturated response, similar to that obtained for the dataset in Figure 7. C, Simulated AMPAR responses of the kinetic scheme (Wadiche and Jahr, 2001) with modified rate constants indicated in blue (inset): rate constants between C1–C3 was decreased by fourfold, whereas C1–C0, C4–C2, C5–O, and C6–C7 were all increased fourfold. The desensitization states are C3–C7, and the asterisks denote [Glut]-dependent transitions. The [Glut] was stepped from 0 to 0.1, 0.2, 0.5, 1, and 10 mm for 100 ms. Gray dashed lines are single-exponential fits. Red lines are the step responses of the WJ model for 0.06 and 10 mm. D, Response of modified AMPAR model (black; from C) to a simulated [Glut]cleft waveform train (data not shown). Mean EPSC trains were constructed for each kinetic scheme by feeding 500 stochastic [Glut]cleft trains through the model and averaging the currents. The peak [Glut]cleft of the quantal component was ∼8 mm, and the steady-state level was 0.06 mm at the end of 10 stimuli. All traces are normalized to their first peak amplitude. The gray trace is a recorded EPSC train from the MF–GC synapse, and the filled circles are mean values averaged across five cells (both taken from Saviane and Silver, 2006). The simulated EPSC trains with the modified kinetic scheme produce much less depression than the original WJ model (red) and are comparable with the experimental data (SS) (Saviane and Silver, 2006). The peak open probabilities were 0.22 and 0.27 for the modified AMPAR model and the WJ model, respectively.

References

    1. Abbott LF, Varela JA, Sen K, Nelson SB. Synaptic depression and cortical gain control. Science. 1997;275:220–224. - PubMed
    1. Akopian G, Walsh JP. Reliable long-lasting depression interacts with variable short-term facilitation to determine corticostriatal paired-pulse plasticity in young rats. J Physiol (Lond) 2007;580:225–240. - PMC - PubMed
    1. Bagal AA, Kao JP, Tang CM, Thompson SM. Long-term potentiation of exogenous glutamate responses at single dendritic spines. Proc Natl Acad Sci USA. 2005;102:14434–14439. - PMC - PubMed
    1. Brenowitz S, Trussell LO. Maturation of synaptic transmission at end-bulb synapses of the cochlear nucleus. J Neurosci. 2001;21:9487–9498. - PMC - PubMed
    1. Canepari M, Nelson L, Papageorgiou G, Corrie JE, Ogden D. Photochemical and pharmacological evaluation of 7-nitroindolinyl-and 4-methoxy-7-nitroindolinyl-amino acids as novel, fast caged neurotransmitters. J Neurosci Methods. 2001;112:29–42. - PubMed

Publication types

Substances

LinkOut - more resources