Comparative Study
. 2007 Aug 1;27(31):8358-65.
doi: 10.1523/JNEUROSCI.1199-07.2007.

Olfactory bulb gamma oscillations are enhanced with task demands

Affiliations
Comparative Study

Olfactory bulb gamma oscillations are enhanced with task demands

Jennifer Beshel et al. J Neurosci. .

Abstract

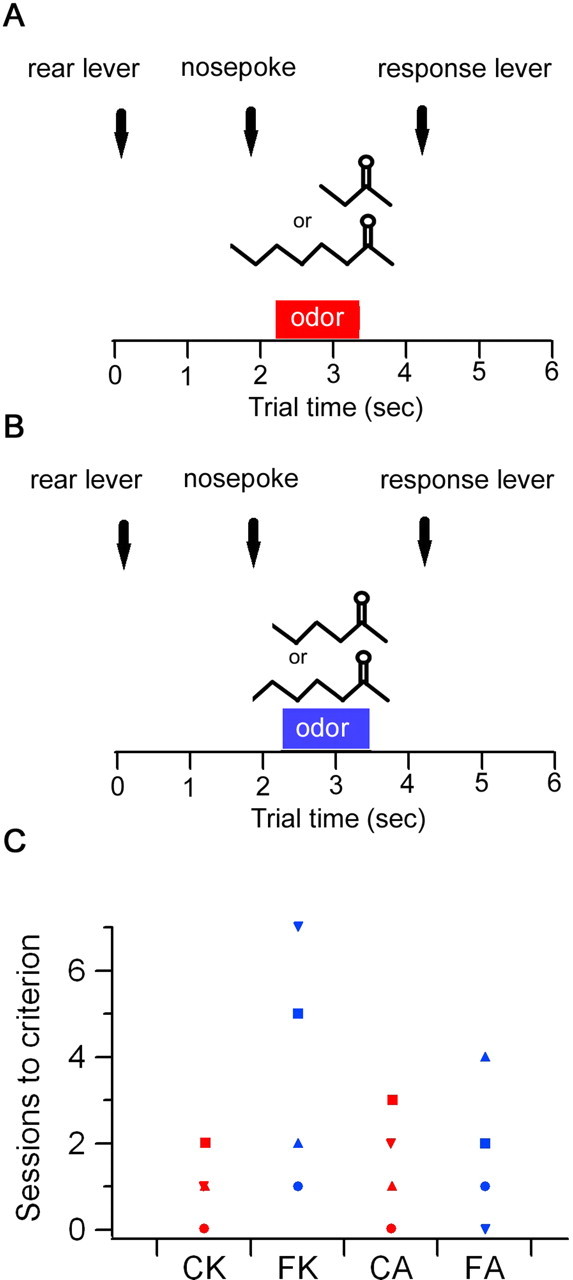
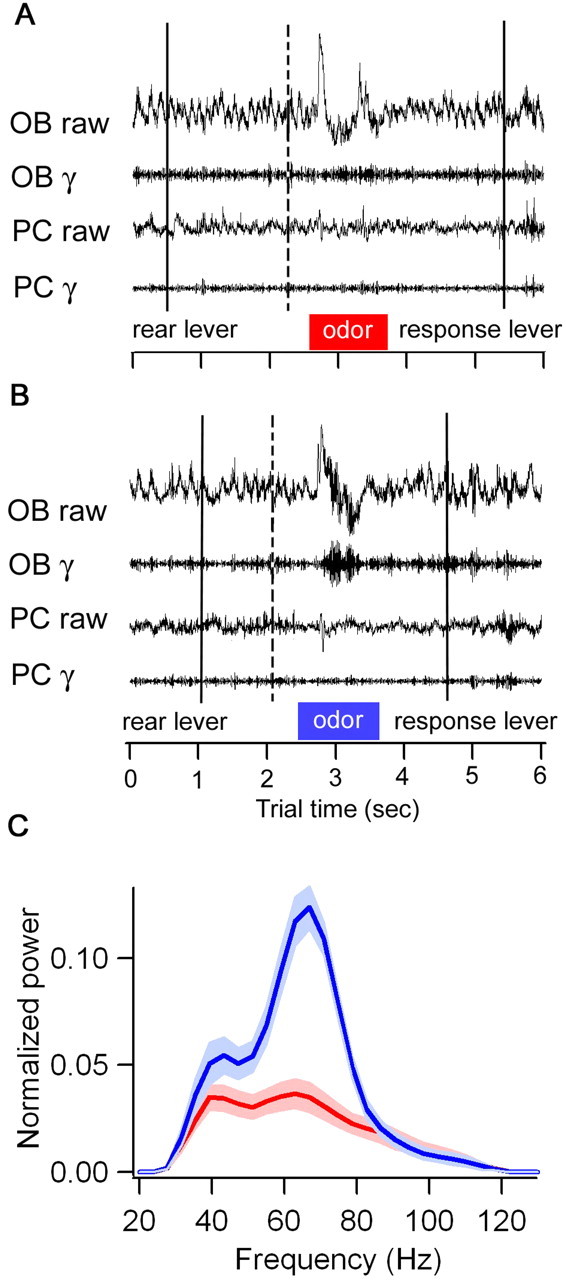
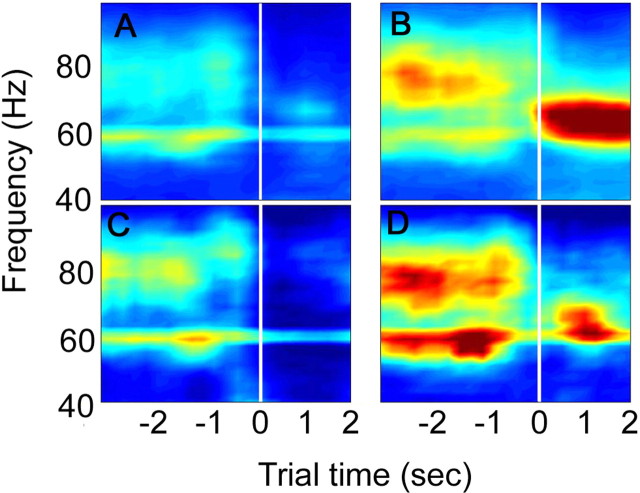
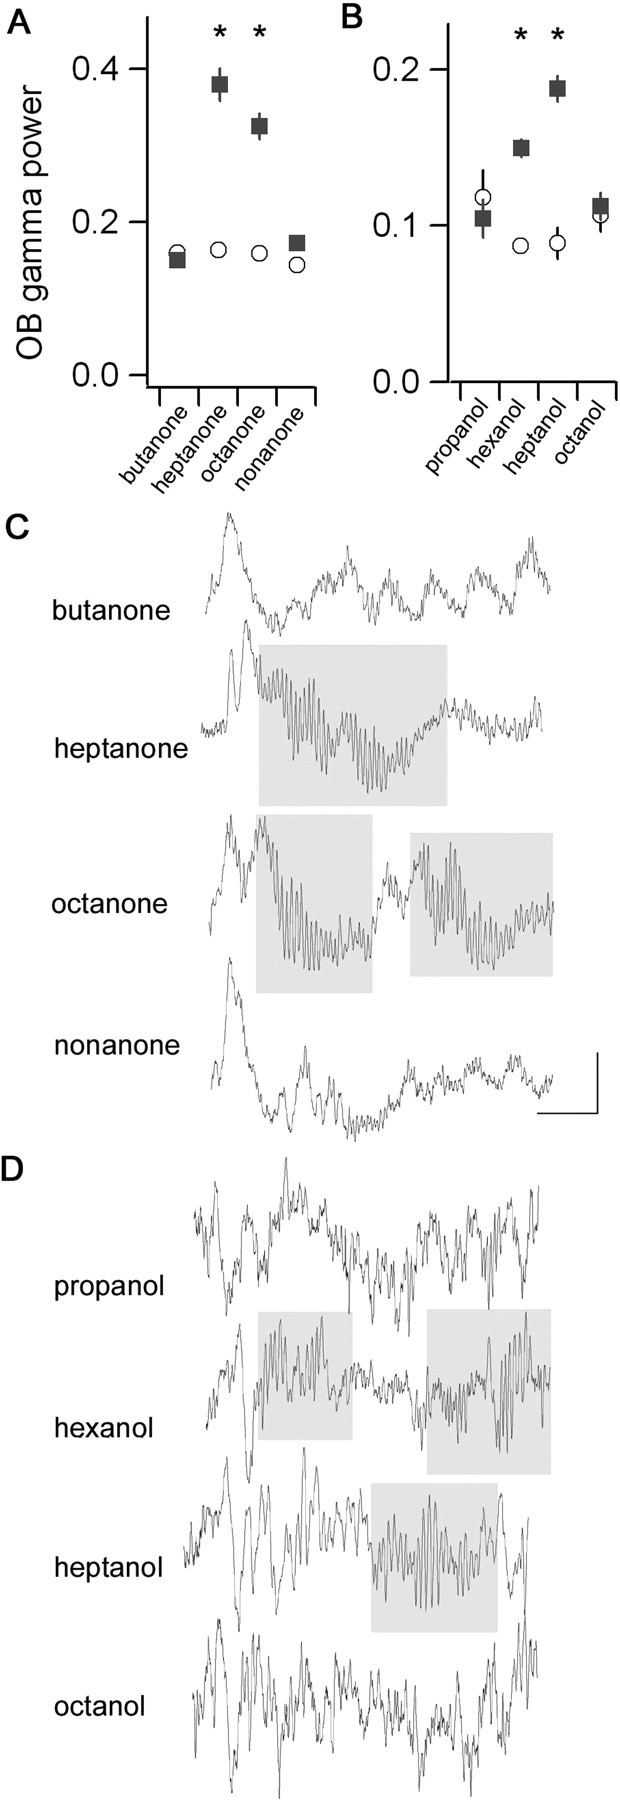
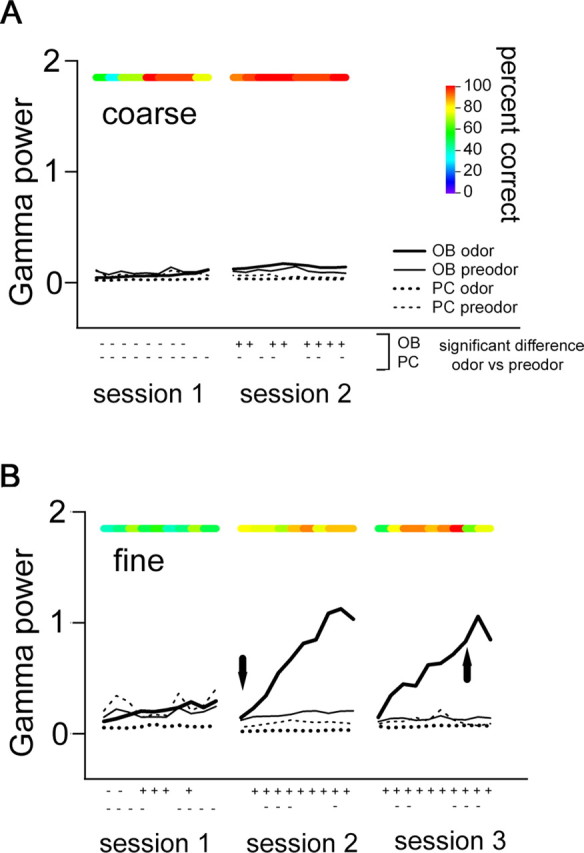
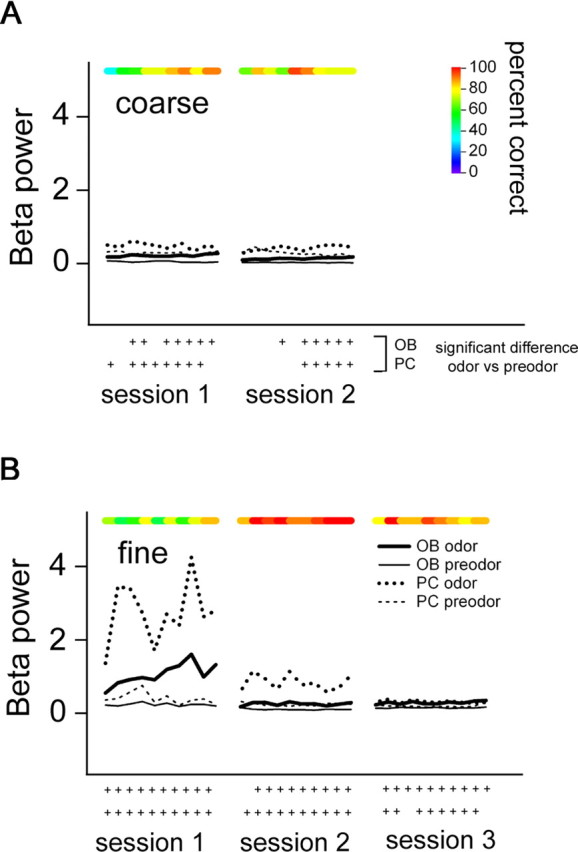
Fast oscillations in neural assemblies have been proposed as a mechanism to facilitate stimulus representation in a variety of sensory systems across animal species. In the olfactory system, intervention studies suggest that oscillations in the gamma frequency range play a role in fine odor discrimination. However, there is still no direct evidence that such oscillations are intrinsically altered in intact systems to aid in stimulus disambiguation. Here we show that gamma oscillatory power in the rat olfactory bulb during a two-alternative choice task is modulated in the intact system according to task demands with dramatic increases in gamma power during discrimination of molecularly similar odorants in contrast to dissimilar odorants. This elevation in power evolves over the course of criterion performance, is specific to the gamma frequency band (65-85 Hz), and is independent of changes in the theta or beta frequency band range. Furthermore, these high amplitude gamma oscillations are restricted to the olfactory bulb, such that concurrent piriform cortex recordings show no evidence of enhanced gamma power during these high-amplitude events. Our results display no modulation in the power of beta oscillations (15-28 Hz) shown previously to increase with odor learning in a Go/No-go task, and we suggest that the oscillatory profile of the olfactory system may be influenced by both odor discrimination demands and task type. The results reported here indicate that enhancement of local gamma power may reflect a switch in the dynamics of the system to a strategy that optimizes stimulus resolution when input signals are ambiguous.


Figures

Figure 1.
Figure 1.
Rats were trained on a two-alternative choice odor discrimination task in which a correct response to either odor was rewarded (see Materials and Methods). A, B, For coarse discrimination, the odors differed by at least four carbons in chain length (A), and, for fine discrimination, the odors differed by only one carbon (B). C, Criterion performance (2 consecutive days of ≥70% correct choice) generally took longer to attain for fine discrimination (blue symbols) compared with coarse discrimination (red symbols) with the ketone odor pairs. Sessions to criterion for fine and coarse alcohol pairs were commensurate. Each symbol denotes one rat. CK, Coarse ketones; FK, fine ketones; CA, coarse alcohols; FA, fine alcohols.
Figure 2.
Figure 2.
Fine odor discrimination elicits higher power gamma oscillatory activity in the LFP of the rat OB relative to gamma power during coarse odor discrimination. A, B, Example of raw and filtered (γ, 35–115 Hz) LFP traces from the rat OB and piriform cortex (PC) during one trial from a criterion session involving coarse (A) and fine (B) discrimination of ketones. C, Power spectra (average of 20 trial block at 85% correct choice; shaded regions indicate ± 1 SEM) for the odor delivery period during coarse (red) and fine (blue) odor discrimination (example from one rat, rf56) reveal a dramatic elevation of gamma power in the OB during fine odor discrimination with reliable increases between 65 and 85 Hz. Gamma power is given in mean ± 1 SEM in square millivolts.
Figure 3.
Figure 3.
Dynamic power spectra show that elevation of gamma power during odor sampling is unique to fine odor discrimination for both odorant functional groups (0 time is the peak of the sensory evoked potential at the onset of odor sampling). A–D, Averages across 200 trials for four separate sessions from the same rat (rf73) at criterion performance for discrimination of ketones paired for coarse (A) and fine (B) discrimination and alcohols paired for coarse (C) and fine (D). Odor onset is indicated by the vertical white line at 0 s. Color scale indicates dimensionless power and is consistent for the four plots. Increases in gamma power are restricted to the odor sampling window (large warm coloration after the vertical white line for fine odor discrimination). Although the example is suggestive, group statistics show no elevation in gamma power during the prestimulus period as a function of task demands.
Figure 4.
Figure 4.
In naive sessions, the magnitude of gamma oscillatory power does not differ with respect to chemical structure. Increases in gamma power are only observable in criterion sessions and thus depend on accurate performance. Only odors paired for fine discrimination display increases in gamma power from naive (open circles) to criterion (filled squares) sessions. A, B, This is true of both ketones (A) and alcohols (B). Although power differs among individual odors in naive sessions, pairwise comparisons show that power does not vary systematically. In criterion sessions, individual odors differ in power in a manner consistent with task demands. Error bars denote ± 1 SEM. *p < 0.0001, significant increase from naive to criterion session. C, D, Example raw LFP traces from the odor sampling period from criterion sessions for ketones (C) and alcohols (D). Traces are arrayed in chain length order for each set, with the top and bottom traces forming the coarse odor pair and the two middle traces forming the fine odor pair. High-amplitude, regular gamma bursts are shaded. Calibration: 100 ms, 0.5 mV.
Figure 5.
Figure 5.
Gamma power during odor sampling evolves dramatically during fine discrimination criterion performance and resets at the beginning of each session. Percentage of correct trials (color bars at top) and averaged gamma band power (vertical axis) were collected across 20 trial blocks for the odor sampling period (thick solid and dashed lines) and prestimulus period (thin solid and dashed lines) for ketone discrimination acquisition (rat rf16 shown). Criterion performance was set at 70% correct. A, For coarse discrimination (butanone/nonanone), criterion performance was attained within the first session and maintained through the second session with little increase in gamma power during odor sampling relative to the prestimulus period. B, For fine discrimination (heptanone/octanone), performance was poor for the first session with levels of gamma power similar to those observed during coarse discrimination. In the subsequent two sessions, the rat performed well and gamma power evolved from relatively low power to dramatically high power across trial blocks. The two lines located underneath each graph indicate significant differences between odor and pre-odor periods for the olfactory bulb (top) and piriform cortex (PC) (bottom); +, odor > pre-odor; −, odor < pre-odor; p < 0.05; blank spaces are NS. Downward arrow signifies first trial block in which performance is high but gamma power is not elevated over pre-odor levels; upward arrow indicates a trial block with elevated gamma power but performance below criterion.
Figure 6.
Figure 6.
Beta oscillatory power (15–28 Hz) during odor sampling is unrelated to the onset of criterion performance in either fine or coarse odor discrimination (same rat as in Fig. 5). Blockwise performance levels and p values are indicated as in Figure 5. A, Coarse discrimination (propanol/octanol) shows significant elevation in beta power in the olfactory bulb and piriform cortex relative to pre-odor periods but no significant variation across sessions. B, Fine odor discrimination (hexanol/heptanol) shows a significant elevation in beta power in the first session, which decreases in the olfactory bulb by the end of the session and remains low thereafter. Piriform cortex beta power stays slightly elevated during the second session, but this pattern is not repeated for ketones or in other rats. Although beta power in the first session of fine discrimination is high for this set of recordings, overall there is only a trend toward an increase in the first session.

Similar articles

Cited by

References

    1. Abraham NM, Spors H, Carleton A, Margrie TW, Kuner T, Schaefer AT. Maintaining accuracy at the expense of speed: stimulus similarity defines odor discrimination time in mice. Neuron. 2004;44:865–876. - PubMed
    1. Bazhenov M, Stopfer M, Rabinovich M, Abarbanel HDI, Sejnowski TJ, Laurent G. Model of cellular and network mechanisms for odor-evoked temporal patterning in the locust antennal lobe. Neuron. 2001;30:569–581. - PMC - PubMed
    1. Borgers C, Epstein S, Kopell NJ. Background gamma rhythmicity and attention in cortical local circuits: a computational study. Proc Natl Acad Sci USA. 2005;102:7002–7007. - PMC - PubMed
    1. Bower JM, Haberly LB. Facilitating and nonfacilitating synapses on pyramidal cells: a correlation between physiology and morphology. Proc Natl Acad Sci USA. 1986;83:1115–1119. - PMC - PubMed
    1. Bressler SL, Freeman WJ. Frequency analysis of olfactory system EEG in cat, rabbit, and rat. Electroencephalogr Clin Neurophysiol. 1980;50:19–24. - PubMed

Publication types

LinkOut - more resources