Comparative Study
. 2007 Aug 1;27(31):8387-94.
doi: 10.1523/JNEUROSCI.1321-07.2007.

Predicting movement from multiunit activity

Affiliations
Comparative Study

Predicting movement from multiunit activity

Eran Stark et al. J Neurosci. .

Abstract

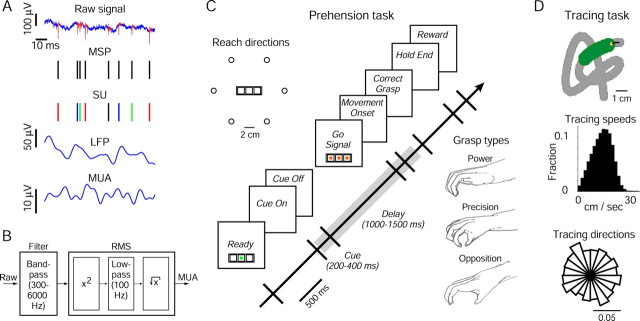
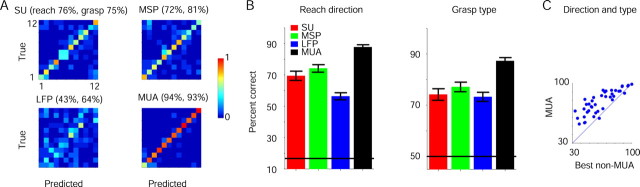
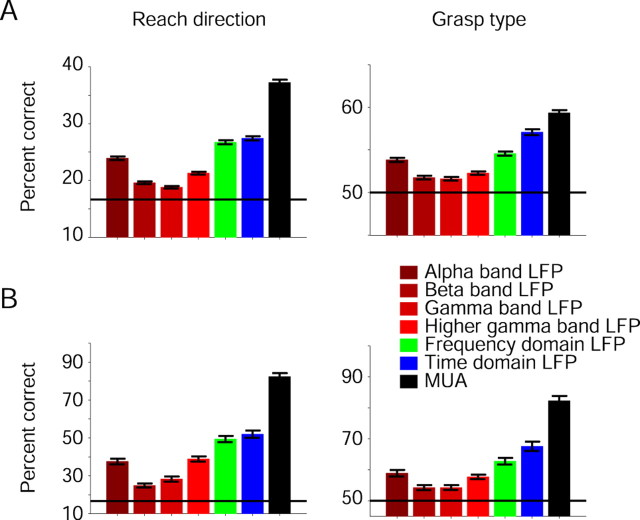
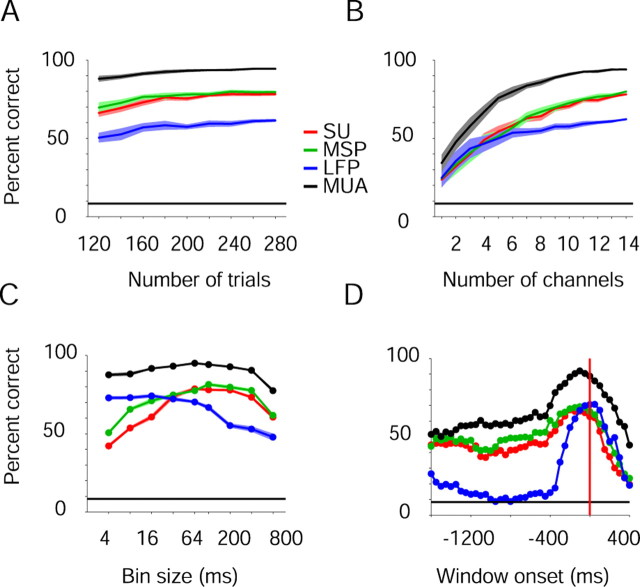
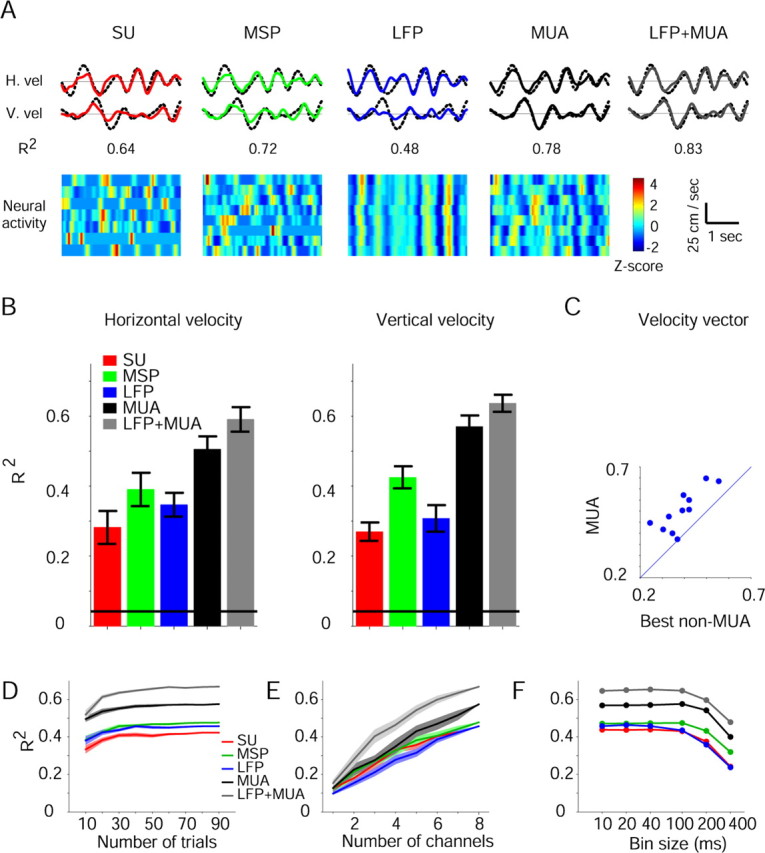
Previous studies have shown that intracortical activity can be used to operate prosthetic devices such as an artificial limb. Previously used neuronal signals were either the activity of tens to hundreds of spiking neurons, which are difficult to record for long periods of time, or local field potentials, which are highly correlated with each other. Here, we show that by estimating multiunit activity (MUA), the superimposed activity of many neurons around a microelectrode, and using a small number of electrodes, an accurate prediction of the upcoming movement is obtained. Compared with single-unit spikes, single MUA recordings are obtained more easily and the recordings are more stable over time. Compared with local field potentials, pairs of MUA recordings are considerably less redundant. Compared with any other intracortical signal, single MUA recordings are more informative. MUA is informative even in the absence of spikes. By combining information from multielectrode recordings from the motor cortices of monkeys that performed either discrete prehension or continuous tracing movements, we demonstrate that predictions based on multichannel MUA are superior to those based on either spikes or local field potentials. These results demonstrate that considerable information is retained in the superimposed activity of multiple neurons, and therefore suggest that neurons within the same locality process similar information. They also illustrate that complex movements can be predicted using relatively simple signal processing without the detection of spikes and, thus, hold the potential to greatly expedite the development of motor-cortical prosthetic devices.


Figures

Figure 1.
Figure 1.
Experimental procedures. A, Extracellular voltage measured by a single microelectrode yields several signals. MSPs are detected and sorted into SUs (different colors). LFPs and MUA are obtained by low- and high-pass filtering, respectively. Spikes are fast (∼1 ms) high amplitude (∼100 μV) events, LFPs capture slow fluctuations (<100 Hz), and MUA recordings reflect energy in high frequencies (300–6000 Hz). B, MUA is estimated by bandpass filtering and taking the RMS. For details, see Materials and Methods. C, Prehension task. The time sequence of a single trial is illustrated. Gray bar, Extent of analysis period (see Materials and Methods). In each trial, an object was briefly presented in one of six locations arranged in a virtual circle around the central button of a touch pad. Grasps were drawn from video recordings of monkeys performing the task. D, Tracing task. In each trial, a path was shown in gray. As the monkey moved the yellow cursor along the path, the green marker was advanced indicating the immediate path the monkey had to follow. This task yielded a rich sampling of movement parameters; histograms show data from one session.
Figure 2.
Figure 2.
Multichannel predictions. A, Neural activity was recorded from PMd and PMv (monkey J) during 188 prehension trials using 13 microelectrodes and 18 SUs. Multichannel activity was used to predict reach direction and grasp type. In each confusion matrix, there are 12 rows and columns, corresponding to six directions per grasp type (1, right, power grip; 2, right, precision grip; 3, top right, power grip…). The i,jth element measures the probability that the ith behavior will be classified as j. Each row adds up to 1; correct predictions are on the diagonal. B, Multichannel prediction accuracies for reach direction (left) and grasp type (right) were averaged over 41 prehension sessions. Horizontal lines, Chance levels (17 and 50%); error bars indicate SEM. C, For each session, the MUA-based prediction accuracy, combined for reach direction and grasp type (chance, 8%), was plotted versus the best non-MUA-based prediction; these measures were correlated (R2 = 0.7). MUA-based predictions were more accurate in almost all sessions.
Figure 3.
Figure 3.
Predictions based on LFPs in the frequency domain. A, Single-channel prediction accuracies were averaged over 471 channels. LFP multiband-based prediction accuracies (green) were higher than single-band predictions (here in red hues; significant only for reach direction, p ≪ 0.001), and time-domain LFP predictions were more accurate than frequency-domain predictions (significant only for grasp type, p < 0.001). MUA-based prediction accuracies were the highest. B, Multichannel prediction accuracies, averaged over 41 prehension sessions. Error bars indicate SEM. MUA-based predictions were the most accurate.
Figure 4.
Figure 4.
Signal properties. A, Modulation of the MUA illustrated in Figure 1A (recorded from PMd) during prehension. The monkey was required to reach in six directions and grasp an object using a power (left) or a precision (right) grip. Data are shown from 1600 ms before movement onset (vertical red lines) until 400 ms after. Horizontal lines, 6 μV. Each panel shows the MUA obtained by smoothing single trials (Gaussian kernel, SD, 30 ms) and averaging over 15 trials (±1 SEM). Activity is strongest for reaches in the top right direction regardless of grip type and for a power grip regardless of reach direction. Bottom, The MUA was used to predict reach and grasp. B, Single-channel prediction accuracies. Averages are shown for 615 SUs, 471 MSPs, LFPs, and MUA recordings, and 69 spikeless MUA recordings. The accuracy of single-channel MUA is higher than the accuracy of any other signal. C, Single-channel SNRs. Vertical red line, Movement onset; bands around each line, SEM. Before movement, the SNR of MUA is highest. D, Single-channel stability. Error bars indicate SEM. The MUA is the most stable signal. E, Channel-pair noise-correlations. A total of 2866 simultaneously recorded MSP, LFP, and MUA pairs (and 5700 SU pairs) were divided into five distance bins, each containing 573–574 sample points (1140 for SUs), and correlations (mean ± SEM) were computed separately for each bin. MUA correlations are of the same order of magnitude as MSP correlations and an order of magnitude lower than LFP correlations.
Figure 5.
Figure 5.
Sample size and temporal dependencies. Neural activity was recorded from PMd and PMv (monkey D) by 14 microelectrodes and 14 SUs during 283 trials. Prediction accuracy, combined for reach direction and grasp type, was estimated. MUA recordings provided the most accurate predictions at all tested numbers of trials, numbers of channels, bin sizes, and window locations. A, Number-of-trials dependency. For each sample size, 20 subsets of distinct trials were randomly sampled and the average predictions plotted with 99% Gaussian confidence limits (2.58 SEM). B, Number-of-channels dependency. Random subsets of distinct channels were sampled 20 times for each sample size. Predictions based on LFP were similar to those based on SU or MSP for up to six channels and then approached a plateau. C, Bin-size dependency. For each trial, neural activity in an 800 ms window centered on movement onset was divided into 1–200 bins (4–800 ms long) and prediction accuracies were estimated. D, Temporal window dependency. Predictions were based on neural activity in a 400 ms window, moved in 50 ms increments from 1600 ms before movement onset (vertical red line) until 400 ms after.
Figure 6.
Figure 6.
Multichannel predictions during tracing. A, Reconstructions of horizontal (top) and vertical (middle) hand velocities during a single tracing trial (colored lines). Dotted black lines show actual velocities and numbers below each trace measure reconstruction quality (R2). Reconstructions were based on the neural activity shown at the bottom (recorded from PMd during one trial and standardized for illustration purposes). B, Reconstruction quality, measured by the coefficient of determination (R2) between actual and predicted velocities, was averaged over 11 tracing sessions, separately for horizontal (left) and vertical (right) velocities. Horizontal lines, Chance R2 values (see Materials and Methods). Error bars indicate SEM. MUA was the best single predictor, although combined information from MUA and LFPs provided the most accurate predictions. C, The MUA-based R2 was plotted versus the highest non-MUA-based R2. Reconstructions based on MUA recordings were more accurate in all sessions. D–F, R2s between the actual and predicted velocity vector were estimated for a single tracing session in which neural activity was recorded by eight microelectrodes (and seven SUs) during the same 96 trials. In all cases, MUA recordings yielded more accurate predictions than the other signals, while combined LFP and MUA predictions were the most accurate. D, Number-of-trials dependency. Conventions are the same as in Figure 5A. E, Number-of-channels dependency. F, Bin-size dependency. For each tracing trial, neural activity in a 400 ms window immediately before movement was divided into 1–40 bins (10–400 ms long) and the R2 of each signal type estimated.

Similar articles

Cited by

References

    1. Abeles M, Goldstein MH. Multispike train analysis. Proc IEEE. 1977;65:762–773.
    1. Andersen RA, Musallam S, Pesaran B. Selecting the signals for a brain-machine interface. Curr Opin Neurobiol. 2004;14:720–726. - PubMed
    1. Bauer R, Brosch M, Eckhorn R. Different rules of spatial summation from beyond the receptive field for spike rates and oscillation amplitudes in cat visual cortex. Brain Res. 1995;669:291–297. - PubMed
    1. Buchwald JS, Grover FS. Amplitudes of background fast activity characteristic of specific brain sites. J Neurophysiol. 1970;33:148–159. - PubMed
    1. Buchwald JS, Halas ES, Schramm S. Comparison of multiple-unit and electro-encephalogram activity recorded from the same brain sites during behavioral conditioning. Nature. 1965;205:1012–1014.

Publication types

LinkOut - more resources