

Bilateral cortical interaction: modulation of delay-tuned neurons in the contralateral auditory cortex
- PMID: 17670987
- PMCID: PMC6673069
- DOI: 10.1523/JNEUROSCI.1257-07.2007
Bilateral cortical interaction: modulation of delay-tuned neurons in the contralateral auditory cortex
Abstract
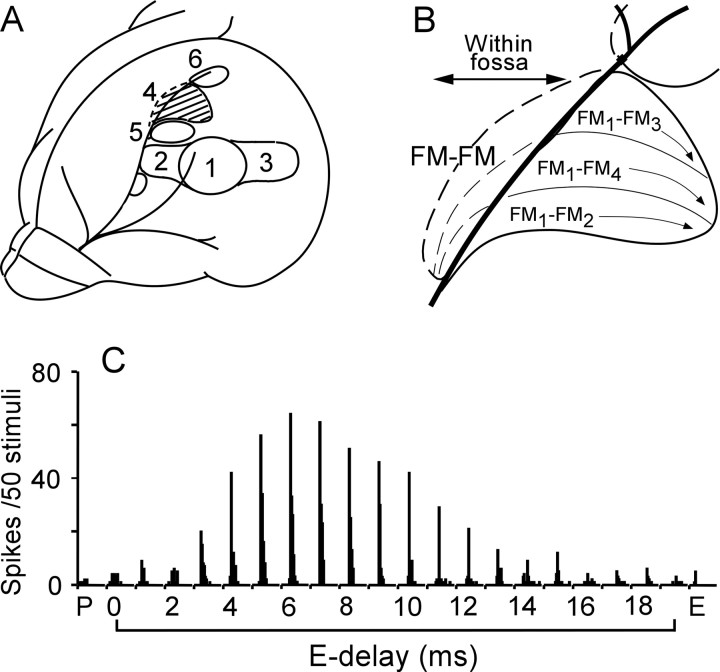
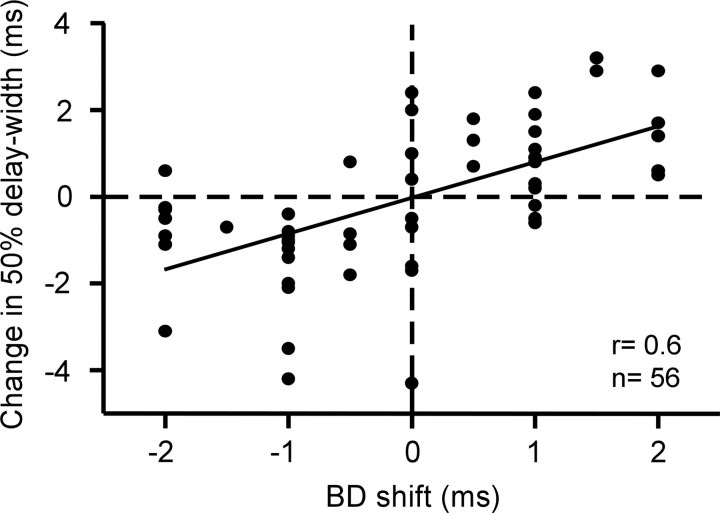
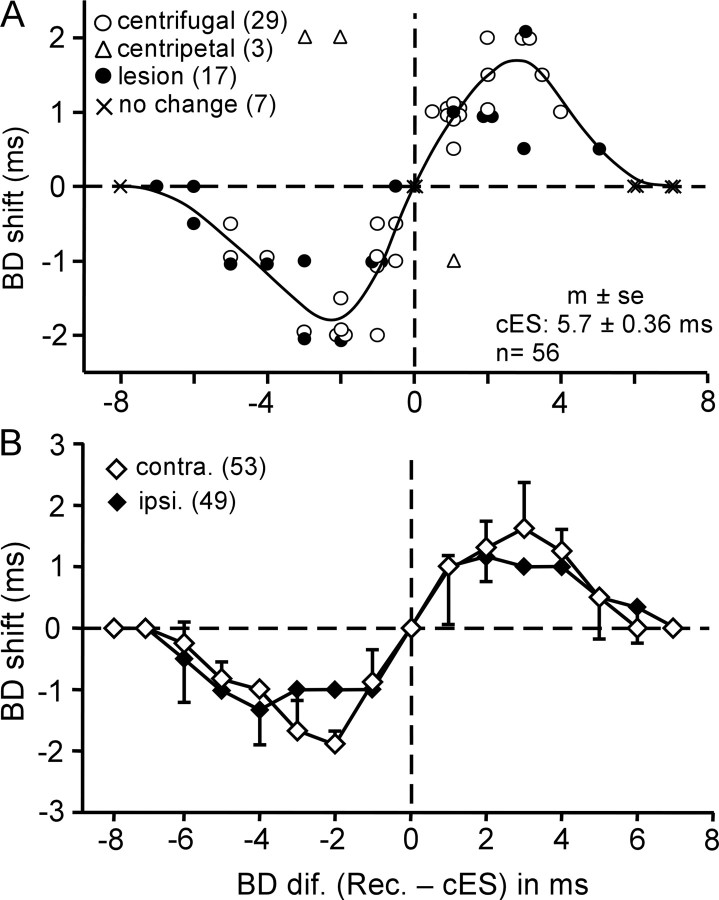
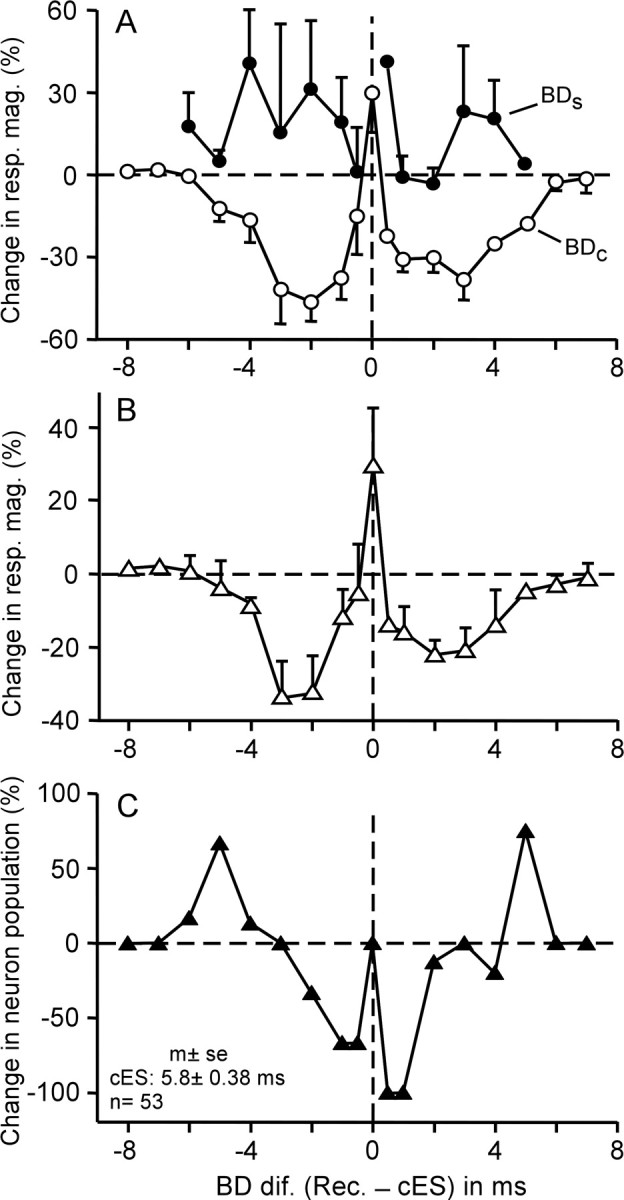
Transcallosal excitation and inhibition have been theorized based on the effect of callosotomy on intractable epilepsy and dichotic listening research, respectively. We studied bilateral interaction of cortical auditory neurons and found that this interaction consisted of focused facilitation and widespread lateral inhibition. The frequency modulated (FM)-FM area of the auditory cortex of the mustached bat is composed of delay-tuned neurons tuned to the combination of the emitted biosonar pulse and its echo with a specific echo delay [best delay (BD)] and consists of three subdivisions in terms of the combination sensitivity of neurons. We found that focal electric stimulation of one of these three subdivisions evoked BD shifts of delay-tuned neurons in all three subdivisions of the contralateral FM-FM area, presumably via the corpus callosum. The effect of electric stimulation of the delay-tuned neurons on the contralateral delay-tuned neurons was different depending on whether the BD of a recorded neuron was matched or unmatched in BD with that of the stimulated neurons. BD-matched neurons did not change their BDs and increased the responses at their BDs, whereas BD-unmatched neurons shifted their BDs away from the BD of the stimulated neurons and reduced their responses. The ipsilateral and contralateral BD shifts evoked by the electric stimulation were identical to each other. The contralateral modulation, in addition to the ipsilateral modulation, increases the contrast in the neural representation of the echo delay to which the stimulated neurons are tuned.
Figures


Similar articles
-
Corticocortical interactions between and within three cortical auditory areas specialized for time-domain signal processing.J Neurosci. 2009 Jun 3;29(22):7230-7. doi: 10.1523/JNEUROSCI.0373-09.2009. J Neurosci. 2009. PMID: 19494145 Free PMC article.
-
Modulation of responses and frequency tuning of thalamic and collicular neurons by cortical activation in mustached bats.J Neurophysiol. 2000 Jul;84(1):325-33. doi: 10.1152/jn.2000.84.1.325. J Neurophysiol. 2000. PMID: 10899207
-
Multiparametric corticofugal modulation of collicular duration-tuned neurons: modulation in the amplitude domain.J Neurophysiol. 2007 May;97(5):3722-30. doi: 10.1152/jn.01268.2006. Epub 2007 Mar 21. J Neurophysiol. 2007. PMID: 17376844
-
Neural processing of auditory signals in the time domain: delay-tuned coincidence detectors in the mustached bat.Hear Res. 2015 Jun;324:19-36. doi: 10.1016/j.heares.2015.02.008. Epub 2015 Mar 6. Hear Res. 2015. PMID: 25752443 Review.
-
Brief and short-term corticofugal modulation of acoustic signal processing in the bat midbrain.Hear Res. 2002 Jun;168(1-2):196-207. doi: 10.1016/s0378-5955(02)00358-1. Hear Res. 2002. PMID: 12117521 Review.
Cited by
-
Corticocortical interactions between and within three cortical auditory areas specialized for time-domain signal processing.J Neurosci. 2009 Jun 3;29(22):7230-7. doi: 10.1523/JNEUROSCI.0373-09.2009. J Neurosci. 2009. PMID: 19494145 Free PMC article.
-
Structural changes of the corpus callosum in tinnitus.Front Syst Neurosci. 2012 Mar 26;6:17. doi: 10.3389/fnsys.2012.00017. eCollection 2012. Front Syst Neurosci. 2012. PMID: 22470322 Free PMC article.
-
Nonlinear spectrotemporal interactions underlying selectivity for complex sounds in auditory cortex.J Neurosci. 2009 Sep 9;29(36):11192-202. doi: 10.1523/JNEUROSCI.1286-09.2009. J Neurosci. 2009. PMID: 19741126 Free PMC article.
-
Inhibitory mechanisms shaping delay-tuned combination-sensitivity in the auditory cortex and thalamus of the mustached bat.Hear Res. 2019 Mar 1;373:71-84. doi: 10.1016/j.heares.2018.12.008. Epub 2018 Dec 24. Hear Res. 2019. PMID: 30612026 Free PMC article.
-
Corticofugal modulation of initial neural processing of sound information from the ipsilateral ear in the mouse.PLoS One. 2010 Nov 16;5(11):e14038. doi: 10.1371/journal.pone.0014038. PLoS One. 2010. PMID: 21124980 Free PMC article.
References
-
- Bloom JS, Hynd GW. The role of the corpus callosum in interhemispheric transfer of information: excitation or inhibition? Neuropsychol Rev. 2005;15:59–71. - PubMed
-
- Buonomano DV, Merzenich MM. Cortical plasticity: from synapses to maps. Annu Rev Neurosci. 1998;21:149–186. - PubMed
-
- Chowdhury SA, Suga N. Reorganization of the frequency map of the primary auditory cortex evoked by focal cortical electrical stimulation in the big brown bat. J Neurophysiol. 2000;83:1856–1863. - PubMed
-
- Clarke S, de Ribaupierre F, Bajo VM, Rouiller EM, Kraftsik R. The auditory pathway in cat corpus callosum. Exp Brain Res. 1995;104:534–540. - PubMed
-
- Diamond IT, Jones EG, Powell TPS. Interhemispheric fiber connections of the auditory cortex of the cat. Brain Res. 1968;11:177–193. - PubMed
Publication types
MeSH terms
Grants and funding
LinkOut - more resources
Full Text Sources