. 2007 Aug 1;21(15):1964-74.
doi: 10.1101/gad.437107.

The PAS/LOV protein VIVID controls temperature compensation of circadian clock phase and development in Neurospora crassa

Affiliations

The PAS/LOV protein VIVID controls temperature compensation of circadian clock phase and development in Neurospora crassa

Suzanne M Hunt et al. Genes Dev. .

Abstract

Circadian clocks are cellular timekeepers that regulate aspects of temporal organization on daily and seasonal time scales. To allow accurate time measurement, the period lengths of clocks are conserved in a range of temperatures--a phenomenon known as temperature compensation. Temperature compensation of circadian clock period aids in maintaining a stable "target time" or phase of clock-controlled events. Here we show that the Neurospora protein VIVID (VVD) buffers the circadian system against temperature fluctuations. In vvd-null mutants, the circadian period of clock-controlled events such as asexual sporulation (conidiation) is temperature compensated, but the phase of this clock time marker is not. Consistent with delayed conidiation at lower temperatures in vvd(KO) strains, the levels of vvd gene products in the wild type increase with decreasing temperatures. Moreover, vvd(C108A) mutants that lack the light function of VVD maintain a dark activity that transiently influences the phase of conidiation, indicating that VVD influences the time of conidiation downstream from the clock. FREQUENCY (FRQ) phosphorylation is altered in a vvd(KO) strain, suggesting a mechanism by which VVD can influence the timing of clock-controlled processes in the dark. Thus, temperature compensation of clock-controlled output is a key factor in maintaining temperature compensation of the entire circadian system.


Figures
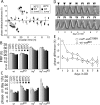
Figure 1.
Figure 1.
VVD affects temperature compensation of clock phase at the output level. (A) The response to temperature pulses is similar in wild type and a vvdKO strain. PRCs were generated with 2-h temperature pulse-up (25°C–30°C) or pulse-down (25°C–20°C) treatments as described in Materials and Methods. The PRC is plotted in CT with the center of the conidial band defined as CT0; i.e., subjective dawn. The PRC graphs the difference in circadian timing of conidiation (the position of the conidial band) in pulsed versus unpulsed controls. The abscissa shows CT in hours when temperature pulse was given, and the ordinate shows phase shift in hours of advance or delay. (Filled symbols) Wild type (wt); (open symbols) vvdKO; (rectangles) 20°C; (circles) 30°C temperature pulse; (error bars) ±SD; n = 6–18. (B,C) vvdKO strains show defects in temperature compensation of clock phase but are temperature compensated for the period. Graph showing average period length (B) and average phase on day one (C) for wild-type (wt), vvdKO, frq7, and frq7, vvdKO strains. frq7 is a long-period (29-h) mutant that has a known defect in temperature compensation of period. Note the increasingly delayed phase at the lower end of the temperature range in vvdKO and frq7, vvdKO strains. Error bars indicate ±1 SD. (D,E) VVD affects time of conidiation at the output level. (D, top panel) Densitometric traces of race tube cultures of vvd+ (black traces) and vvdC108A (white traces) strains. Arrows above the traces highlight the peaks of conidiation. Notice the identical phase on day 1 of both strains, but subsequent establishment of a constant phase delay between strains. (Bottom panel) As above, but race tube cultures are those of vvd+ (black traces) and vvdKO (white traces) strains. Notice the constant phase delay of vvdKO strains compared with wild type. (Center trace) Mean; (outside traces) ±1 SE; n = 6. (E) Graph showing the differences in peaks of conidiation (in hours) between vvd+ and vvd mutant strains plotted against the number of days in DD. Error bars indicate ±1 SD. (Broken line) Line of identical phase.
Figure 2.
Figure 2.
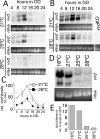
vvd transcript levels are temperature regulated. (A) Northern blots showing vvd transcript levels in the first day of DD at the indicated temperatures. Mycelial discs were grown in liquid culture at 21°C, 25°C, and 28°C, and tissue was harvested at the indicated time points in DD. Transcript levels peak around DD12 and decline below detection limits by DD24. Two transcripts can be distinguished. (B) Experiment as described in A, but only 21°C and 28°C data are shown and blots are overexposed to highlight the difference at extreme temperatures. Total RNA from a vvdKO strain was loaded to control for signal specificity. (C) Quantitative analysis of Northern blot data from three independent experiments graphed as percentage of maximal expression. Error bars indicate ±1 SD. (D) Levels of vvd transcript extracted from tissue harvested at DD12 at the indicated temperatures. (E) Quantitative analysis of Northern blot data shown in D. The lowest transcript levels (at 28°C) are set to 1 to document the fold increase with decreasing temperature. All Northern blots are accompanied by panels of corresponding ethidium-bromide (EtBr)-stained ribosomal RNA (rRNA) to document loading.
Figure 3.
Figure 3.
VVD protein levels are temperature regulated. (A) Western blot analysis following VVD levels in DD at the indicated temperatures. Cultures were grown as described in Figure 2A. Fifteen micrograms of protein were loaded per lane and Western blots were hybridized with a MYC-specific monoclonal antibody. (B) Quantitative analysis of three independent experiments, as shown in A, graphed as percentage of maximal expression at 16°C at DD4. Error bars indicate ±1 SD; n = 3; n = 2 for 16°C. (C) Western blots showing VVD levels in 12:12 LD entrainment conditions at 16°C, 21°C, and 28°C. (D) Similar experiment as shown in C showing VVDC108A levels. (E) Similar experiment as in C and D with VVD wild-type (VVD) and VVDC108A (C108A) samples loaded on the same gel to visualize the differences in protein levels between both strains at 21°C and 28°C. VVDC108A levels are higher than wild-type VVD levels at both temperatures. (F) Quantitative analysis of 21°C and 28°C data shown in CE; n = 3 or 4. Protein levels are normalized to maximum levels. (G) Same as in F, but protein levels are normalized to levels at LD12 (end of light period) to emphasize the kinetics of VVD turnover after the LD transition. (H) Quantitative analysis of an experiment as described in F performed at 16°C and 21°C and graphed as the percentage of maximal expression. VVD levels show a further increase when the temperature is lowered to 16°C and VVDC108A levels are again higher than VVD wild-type levels in all conditions. All error bars indicate ±1 SE. Black and white bars indicate lights off or on, respectively.
Figure 4.
Figure 4.
Temperature regulation of vvd transcript levels is not dependent on a functional frq gene. (A) Northern blot showing vvd transcript levels in wild-type and frq-null (frq10) strains at DD12 (peak levels of vvd) at 21°C and 28°C. EtBr-stained rRNA is shown to document even loading. (B) Quantitative analysis of Northern blot data shown in A. For each strain, vvd RNA levels at 21°C were set to 100%.
Figure 5.
Figure 5.
VVD changes the dynamics of FRQ protein phosphorylation. (A) Western blots showing FRQ levels in wild-type (top panels) and vvdKO strains (bottom panels) at different ambient temperatures in DD. Amido black-stained membranes are shown below each blot to document even loading. (B) Quantitation of total FRQ levels using Western blots shown in A, graphed as the percentage of maximal FRQ expression. Peak and trough levels of total FRQ protein show a 4- to 8-h delay in vvdKO (right graph) strains when compared with wild type (left graph), except at 28°C in a vvdKO strain (right graph). (C) Quantitative analysis of different phosphorylation states (FRQa–FRQd), as shown in A at 21°C in DD in wild-type (left graph) and vvdKO (right graph) strains graphed as the percentage of maximal expression.
Figure 6.
Figure 6.
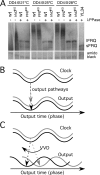
(A) The relative amounts of lFRQ and sFRQ are not significantly altered in vvdKO strains, when compared with wild type (wt). Samples of total protein extracts from wild-type and vvdKO strains harvested at DD4 at the indicated temperatures either untreated or treated with λ phosphatase (λPPase) to investigate concentrations of lFRQ and sFRQ. The last lane shows a λPPase-treated protein from the strain YL34, a strain that produces only sFRQ. Amido black-stained membranes are shown below the blot to document loading. (B,C) A model for the control of temperature compensation of clock-controlled output pathways (such as circadian conidiation in Neurospora). (B) A temperature-compensated clock with similar period and phase at low temperatures (gray line) or high temperatures (black line) controls temperature-independent pathways. (C) A temperature-compensated clock with similar period and phase at low temperatures (gray line) or high temperatures (black line) controlling output pathways that are temperature dependent. Increased levels of VVD at lower temperatures compensate for such temperature-dependent processes.

References

    1. Bell-Pedersen D., Cassone V.M., Earnest D.J., Golden S.S., Hardin P.E., Thomas T.L., Zoran M.J., Cassone V.M., Earnest D.J., Golden S.S., Hardin P.E., Thomas T.L., Zoran M.J., Earnest D.J., Golden S.S., Hardin P.E., Thomas T.L., Zoran M.J., Golden S.S., Hardin P.E., Thomas T.L., Zoran M.J., Hardin P.E., Thomas T.L., Zoran M.J., Thomas T.L., Zoran M.J., Zoran M.J. Circadian rhythms from multiple oscillators: Lessons from diverse organisms. Nat. Rev. Genet. 2005;6:544–556. - PMC - PubMed
    1. Brunner M., Diernfellner A., Diernfellner A. How temperature affects the circadian clock of Neurospora crassa. Chronobiol. Int. 2006;23:81–90. - PubMed
    1. Cheng P., Yang Y., Heintzen C., Liu Y., Yang Y., Heintzen C., Liu Y., Heintzen C., Liu Y., Liu Y. Coiled-coil domain-mediated FRQ–FRQ interaction is essential for its circadian clock function in Neurospora. EMBO J. 2001;20:101–108. - PMC - PubMed
    1. Cheng P., Yang Y.H., Gardner K.H., Liu Y., Yang Y.H., Gardner K.H., Liu Y., Gardner K.H., Liu Y., Liu Y. PAS domain-mediated WC-1/WC-2 interaction is essential for maintaining the steady-state level of WC-1 and the function of both proteins in circadian clock and light responses of Neurospora. Mol. Cell. Biol. 2002;22:517–524. - PMC - PubMed
    1. Colot H.V., Loros J.J., Dunlap J.C., Loros J.J., Dunlap J.C., Dunlap J.C. Temperature-modulated alternative splicing and promoter use in the circadian clock gene frequency. Mol. Biol. Cell. 2005;16:5563–5571. - PMC - PubMed

Publication types

Substances