. 2008 Oct;100(4):2328-47.
doi: 10.1152/jn.00344.2007. Epub 2007 Aug 1.

Lock-and-key mechanisms of cerebellar memory recall based on rebound currents

Affiliations

Lock-and-key mechanisms of cerebellar memory recall based on rebound currents

Daniel Z Wetmore et al. J Neurophysiol. 2008 Oct.

Abstract

A basic question for theories of learning and memory is whether neuronal plasticity suffices to guide proper memory recall. Alternatively, information processing that is additional to readout of stored memories might occur during recall. We formulate a "lock-and-key" hypothesis regarding cerebellum-dependent motor memory in which successful learning shapes neural activity to match a temporal filter that prevents expression of stored but inappropriate motor responses. Thus, neuronal plasticity by itself is necessary but not sufficient to modify motor behavior. We explored this idea through computational studies of two cerebellar behaviors and examined whether deep cerebellar and vestibular nuclei neurons can filter signals from Purkinje cells that would otherwise drive inappropriate motor responses. In eyeblink conditioning, reflex acquisition requires the conditioned stimulus (CS) to precede the unconditioned stimulus (US) by >100 ms. In our biophysical models of cerebellar nuclei neurons this requirement arises through the phenomenon of postinhibitory rebound depolarization and matches longstanding behavioral data on conditioned reflex timing and reliability. Although CS-US intervals<100 ms may induce Purkinje cell plasticity, cerebellar nuclei neurons drive conditioned responses only if the CS-US training interval was >100 ms. This bound reflects the minimum time for deinactivation of rebound currents such as T-type Ca2+. In vestibulo-ocular reflex adaptation, hyperpolarization-activated currents in vestibular nuclei neurons may underlie analogous dependence of adaptation magnitude on the timing of visual and vestibular stimuli. Thus, the proposed lock-and-key mechanisms link channel kinetics to recall performance and yield specific predictions of how perturbations to rebound depolarization affect motor expression.


Figures

FIG. 1.
FIG. 1.
Neural pathways and stimulus timing requirements for eyeblink conditioning. A: neural pathways involved in delay eyeblink conditioning. Cerebellar climbing fibers (CFs) originate in the inferior olive (IO) and convey activity driven by the unconditioned stimulus (US). Mossy fibers (MFs) originate in the pons and convey activity driven by the conditioned stimulus (CS). The Golgi (Go) and granule (Gr) cell network processes the CS-driven signals. Purkinje (Pkj) cells receive synaptic inputs from parallel fiber (PF) axons of Gr cells. Pkj cells send GABAergic projections to neurons in the deep cerebellar nuclei (DCN) that drive conditioned motor responses via the red nucleus (RN). B: the reliability of conditioned responses to a CS in trained rabbits, as a function of the CS–US interstimulus interval (ISI) used in training. Data were collected from classic studies of Smith et al. (1969; solid black line and black squares), Salafia et al. (1980; dotted blue line and blue diamonds), Smith (1968; solid red line and red triangles), and Schneiderman and Gormezano (1964; dotted green line and green circles).
FIG. 2.
FIG. 2.
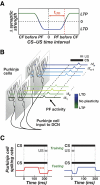
Cerebellar memory formation based on temporally sparse granule cell coding and bidirectional plasticity at the PF–Purkinje cell synapse. A: the relative timing of PF and CF activation sets the propensity toward long-term depression (LTD) or long-term potentiation (LTP). Maximal LTD induction arises when PF activity precedes CF activity by up to a time, tLTD, of about 75 ms, but LTD can also occur when CF activity slightly precedes PF activity (Coesmans et al. 2004; Wang et al. 2000). B: in classical eyeblink conditioning, individual PFs are assumed to exhibit elevated activity during only a brief portion of the CS. By the plasticity rule in A, some PF inputs will be strengthened and others depressed, depending on the relative timing of PF and US-driven CF activity. DCN cells receive input from populations of Purkinje cells whose activity reflects aggregate input from CS-activated PFs. C: repeated CS–US training (top) leads to biphasic CS-driven Purkinje cell spiking due to the bidirectional plasticity shown in B. In subjects that received forward training (bottom left), spiking rises and then falls relative to baseline (red curve). In subjects that received backward training (bottom right), spiking falls and then rises (blue curve). The red arrows (bottom left) correspond to tLTD.
FIG. 3.
FIG. 3.
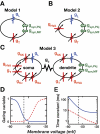
Compartmental modeling of T-type Ca2+ current rebounds in DCN cells. Compartmental simulations of a Purkinje target neuron in the DCN involved 3 models of increasing complexity. A: Model 1 has one electrical compartment, contains T (gT) and leak (gL) conductances, and receives glutamatergic mossy fiber and GABAergic Purkinje cell inputs. Membrane voltage follows a deterministic time course. B: Model 2 adds high-voltage-activated Ca2+ (gHVA) channels. Synaptic inputs arrive stochastically, leading to membrane potential fluctuations and nondeterministic dynamics. C: Model 3 has dendritic and somatic compartments, coupled by a conductance gc. Synaptic inputs are localized to the dendrite, approximating empirical findings. The soma has fast Na+ (gNa) and delayed rectifier K+ (gKv) conductances. Both compartments have leak, T, Ca2+-activated K+ (SK), and HVA Ca2+ conductances. Synaptic inputs arrive stochastically, leading to nondeterministic dynamics. D: voltage dependence of the activation (dashed red curve) and inactivation (solid blue curve) gating variables for the T-type conductance in DCN neurons. At the resting potential (about −58 mV, dashed vertical line), T-currents are largely inactivated. Hyperpolarization deinactivates T-currents, allowing activation during subsequent depolarization. E: voltage dependence of the T-channel activation (dashed red curve) and inactivation (solid blue curve) time constants. Parameter dependencies in D and E are based on Gauck et al. (2001) and McRory et al. (2001).
FIG. 4.
FIG. 4.
DCN cell rebounds require a minimum CS–US ISI and sufficient expression of cerebellar LTP and LTD. A: the time course of CS-driven depolarization in Model 1 (Fig. 3A). If prior training involved a sufficiently positive ISI, the CS-driven rebound is of large amplitude and occurs at a time approximately tLTD before the expected US (red traces). If training involved an insufficient ISI value, CS-driven rebounds do not occur (blue traces). For short ISI values, rebounds are diminished in amplitude (orange trace). The color bar indicates the ISI values, which are also marked above the graph with the color corresponding arrowheads for each voltage trace. Rebounds occur prior to the expected US, indicating anticipatory responses. B: rebound amplitude varies with the degree to which the CS drives biphasic Purkinje cell activity. This, in turn, depends on having sufficient expression of both PF–Purkinje cell LTP and LTD (Fig. 2). Driving a large-amplitude rebound in the DCN cell requires that during the first phase of biphasic activity the Purkinje cell spiking rate rises well above the spontaneous frequency of 40 Hz. The 3 voltage traces (blue, cyan, red traces) in B1 occurred with the color corresponding, Purkinje cell peak spiking rates shown in B2. Lower peak spiking rates reflect lower expression levels of LTP. The arrowhead indicates the ISI value of 200 ms. C: driving a large-amplitude rebound in the DCN cell also requires that during the second phase of biphasic activity the Purkinje cell spiking frequency drops below the 40 Hz spontaneous rate. The 3 voltage traces in C1 (blue, cyan, red) were created using the color corresponding, Purkinje cell minimum spiking rates shown in C2. The higher rates reflect lesser degrees of LTD. The arrowhead indicates the ISI value of 200 ms.
FIG. 5.
FIG. 5.
Readout of rebounds via Ca2+ spikes leads to a dependence of the response reliability on the CS–US ISI. A: sample voltage traces during CS presentation in Model 2 (Fig. 3B) in the presence of membrane potential fluctuations from noisy synaptic inputs. At an intermediate ISI of 100 ms, a T-current-mediated rebound depolarization triggers a Ca2+ spike during one trial (dashed red line) but not another (solid blue line). B: the reliability of learned responses in Model 2 (closed green triangles) and Model 3 (closed blue circles), defined as the probability of generating a dendritic Ca2+ spike in response to a test CS, plotted as a function of the ISI. Classic data on the reliability of conditioned blinks in trained rabbits are replotted from Fig. 1 (open red symbols) (Salafia et al. 1980; Smith 1968; Smith et al. 1969), showing the similarity to the model data. A tLTD of 75 ms was used for the model data, consistent with empirical data indicating tLTD is in the range of about 50–200 ms (Wang et al. 2000). C and D: example voltage traces from the dendritic and somatic compartments of Model 3 (Fig. 3C) during CS presentation with an ISI of 200 ms. A T-mediated rebound depolarization leads to a high-voltage-activated dendritic Ca2+ spike (C) that drives a rise in the somatic Na+ spike rate (D). E: the corresponding time courses of the activation (n, solid red curve) and inactivation (l, dashed blue curve) gating variables during the Ca2+ spike.
FIG. 6.
FIG. 6.
Phase plane analysis of CS-driven rebounds. A: membrane voltage time course (blue curve) in response to a CS that initiates at time t = 0 in Model 1, under the approximation of instantaneous relaxation of the T-channel activation variable to its asymptotic value. The rebound peaks at a time about 40 ms prior to the expected US at 200 ms after CS onset. Dashed vertical lines delineate 3 stages of the phase plane trajectory in B. B: the state trajectory (blue curve) in the 2-dimensional (2-D) phase plane defined by the voltage (V) and T-type inactivation variable (l), corresponding to the voltage trace in A. The open black circle marks the fixed-point in the resting state (stage 1). The open green triangle marks the fixed-point from CS onset until approximately tLTD prior to the expected US (stage 2). The open red square marks the fixed-point during the remainder of the CS (stage 3). According to longstanding convention, channels are completely inactivated when l = 0 (Hodgkin and Huxley 1952). C: a color plot conveying the amplitude of the rebound that occurs during stage 3 for the state trajectory passing through each point in the phase plane of B and converging toward the stage 3 fixed-point (open red square). Warmer hues indicate the larger rebounds (color bar) that initiate if during stage 2 the system has successfully entered the “memory reliability zone” near the stage 2 fixed-point (open green triangle). White curves are example state trajectories. D: the addition of high-voltage-activated (HVA) Ca2+ channels to the phase plane analysis of C reveals those stage 3 trajectories that lead to a Ca2+ spike (red trajectories) and those that do not (blue trajectories). All of the trajectories closely concur with those in Model 1 (C) in the voltage range V < −35 mV over which the HVA Ca2+ channels are largely closed. The red trajectories, which initiate within the reliability zone near the stage 2 fixed-point (green triangle), cross the Ca2+ spike threshold and allow successful readout of the rebound (Fig. 5, A and B). Horizontal dotted lines indicate the resting potential of −58 mV in AD. Solid and dashed black curves in B, C, and D are nullclines during the resting state for the l and V variables, respectively, on which the time derivatives dl/dt and dV/dt, respectively, vanish during stage 1.
FIG. 7.
FIG. 7.
Vestibular nuclei cell rebounds lead to temporally asymmetric vestibulo-ocular reflex (VOR) adaptation. A: vestibulo-cerebellar pathways for VOR horizontal gain adaptation involve Purkinje cells (Pkj) that project to target neurons within the medial vestibular nucleus (MVN). Neurons in the MVN project to brain stem motor nuclei (MNs) that drive eye movement. Slip of the visual scene on the retina is conveyed to the cerebellum via climbing fibers (CFs). Information about head velocity arrives via mossy fibers (MFs) originating in the vestibular ganglia (VG), is processed within the Golgi (Go) and granule (Gr) cell network, and reaches Purkinje cells by way of parallel fibers (PFs). Conjunctive arrival of CF and PF signals is thought to induce synaptic plasticity at the PF–Pkj synapse that underlies gain adaptation. B: a one-compartment model of an MVN Purkinje target neuron that contains h- (gh) and leak (gL) conductances and receives glutamatergic mossy fiber and GABAergic Purkinje cell input. Membrane voltage follows a deterministic time course. C: primate behavioral data from well-known studies in which pulses of head rotation (top, black bars) were paired during training with moving dot visual stimuli (top, gray bars) at 3 distinct ISIs. During later testing with pulsed head rotations in the dark, the learned component of VOR expression increased markedly with greater ISI values (bottom, green, blue, and red curves) (Raymond and Lisberger 1996). D: relative rebound amplitude as a function of the h-current activation time constant τq. The plot shows the maximum depolarization from the resting potential following training with zero (green), short (blue), and long (red) ISIs, normalized for each value of τq by the maximum depolarization of the zero ISI trajectory (green). Dashed black line indicates τq of 400 ms used for simulations shown in E. E: voltage traces (top) and state trajectories (bottom) from the model MVN cell in response to a test pulse of head rotation following training with the 3 different ISI values shown in C. The 3 state trajectories (bottom) traverse the 2-D phase plane defined by the voltage (V) and the activation level of the h-current relative to that at rest (h). Horizontal dashed lines in the top panels indicate the resting potential of −58 mV. The solid and dashed black curves in the bottom panels are the nullclines during the resting state for V and h, respectively, on which their respective time derivatives vanish. Vertical dashed lines in C and E mark the period of head rotation.
FIG. 8.
FIG. 8.
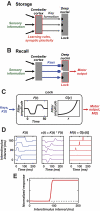
A lock-and-key description of memory recall. A: schematic of memory formation within the lock-and-key description. Paired PF and CF activity induces synaptic plasticity in the cerebellar cortex. This shapes Purkinje cell “key” activity in response to subsequent presentations of the learned sensory input. B: schematic of memory recall, in which the lock resides in the DCN. Key activity driven by learned sensory input is sent to the DCN via Purkinje cell axons. Not all keys will be successful at driving DCN cell activity and learned motor responses. The lock prevents inappropriate motor responses by filtering out nonmatching key activity. Partially matching key activity leads to unreliable recall or responses of diminished amplitude. C: an implementation of a lock-and-key mechanism using a linear–nonlinear (L-N) filter model, similar to those used to describe sensory receptive fields. Key activity, K(t), undergoes linear filtering according to F(t), then the result is filtered by a nonlinear threshold function, G(x). D: the L-N model enables responses, equal to G[K(t) * F(t)], to be made selectively to only those keys, K(t), that are shaped by training with sufficiently positive ISI values. E: response of the L-N model as a function of ISI in eyeblink conditioning. The results mimic those of DCN cell simulations (Figs. 4–6) and the classic rabbit behavioral data (Figs. 1B and 5B).

Similar articles

Cited by

References

    1. Abbott LF, Nelson SB. Synaptic plasticity: taming the beast. Nat Neurosci Suppl 3: 1178–1183, 2000. - PubMed
    1. Aizenman CD, Linden DJ. Regulation of the rebound depolarization and spontaneous firing patterns of deep nuclear neurons in slices of rat cerebellum. J Neurophysiol 82: 1697–1709, 1999. - PubMed
    1. Aizenman CD, Linden DJ. Rapid, synaptically driven increases in the intrinsic excitability of cerebellar deep nuclear neurons. Nat Neurosci 3: 109–111, 2000. - PubMed
    1. Aizenman CD, Manis PB, Linden DJ. Polarity of long-term synaptic gain change is related to postsynaptic spike firing at a cerebellar inhibitory synapse. Neuron 21: 827–835, 1998. - PubMed
    1. Aksenov DP, Serdyukova NA, Bloedel JR, Bracha V. Glutamate neurotransmission in the cerebellar interposed nuclei: involvement in classically conditioned eyeblinks and neuronal activity. J Neurophysiol 93: 44–52, 2005. - PubMed

Publication types

MeSH terms