. 2007 Oct;18(10):3928-40.
doi: 10.1091/mbc.e07-04-0346. Epub 2007 Aug 1.

Intrinsic dynamic behavior of fascin in filopodia

Affiliations

Intrinsic dynamic behavior of fascin in filopodia

Yvonne S Aratyn et al. Mol Biol Cell. 2007 Oct.

Abstract

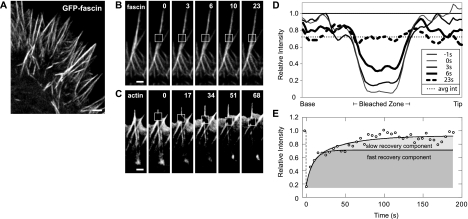
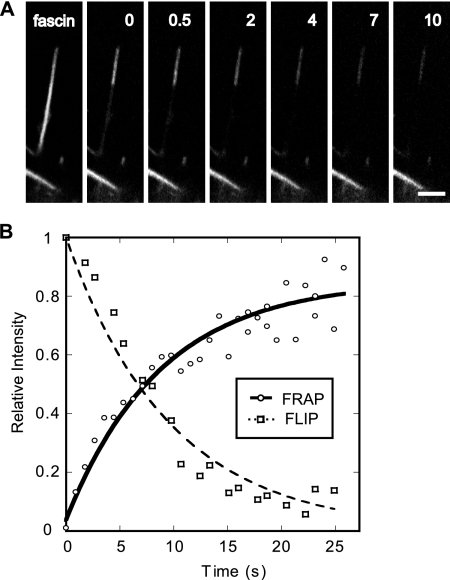
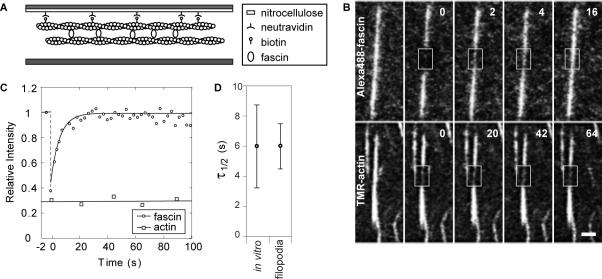
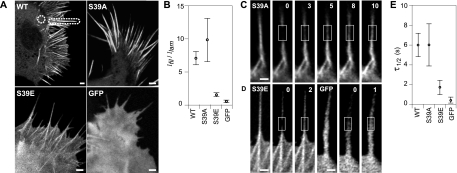
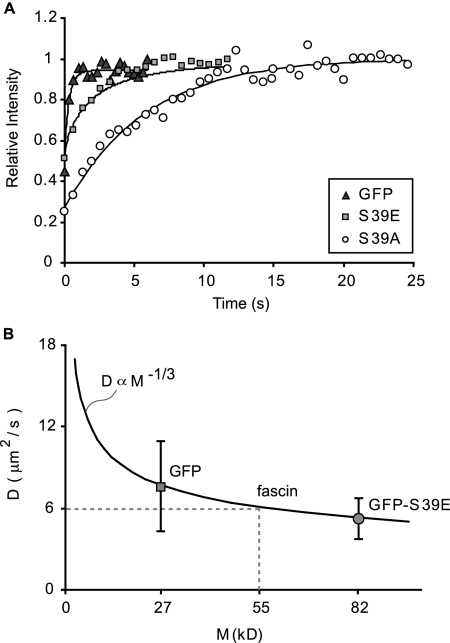
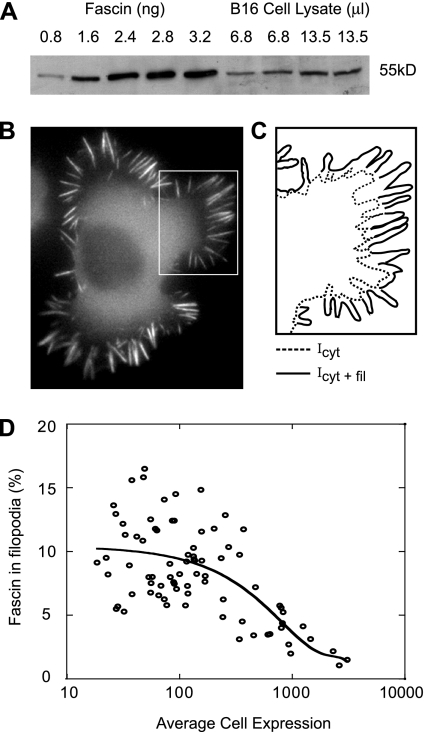
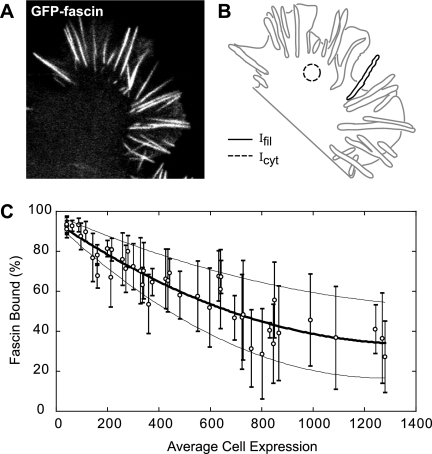
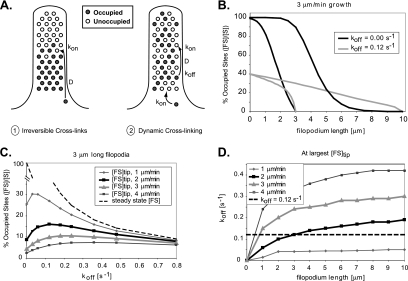
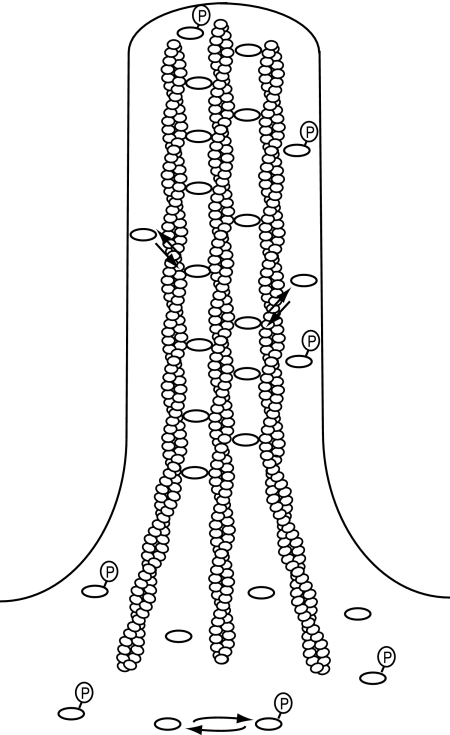
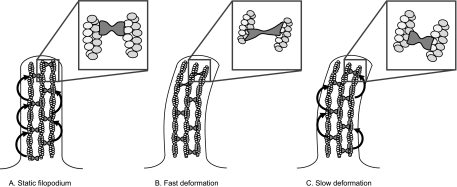
Recent studies showed that the actin cross-linking protein, fascin, undergoes rapid cycling between filopodial filaments. Here, we used an experimental and computational approach to dissect features of fascin exchange and incorporation in filopodia. Using expression of phosphomimetic fascin mutants, we determined that fascin in the phosphorylated state is primarily freely diffusing, whereas actin bundling in filopodia is accomplished by fascin dephosphorylated at serine 39. Fluorescence recovery after photobleaching analysis revealed that fascin rapidly dissociates from filopodial filaments with a kinetic off-rate of 0.12 s(-1) and that it undergoes diffusion at moderate rates with a coefficient of 6 microm(2)s(-1). This kinetic off-rate was recapitulated in vitro, indicating that dynamic behavior is intrinsic to the fascin cross-linker. A computational reaction-diffusion model showed that reversible cross-linking is required for the delivery of fascin to growing filopodial tips at sufficient rates. Analysis of fascin bundling indicated that filopodia are semiordered bundles with one bound fascin per 25-60 actin monomers.


Figures

Figure 1.
Figure 1.
Fascin exchanges rapidly in filopodia. (A) Confocal image of N2a cell expressing GFP-fascin. GFP-fascin localizes along the entire length of filopodia. Time-lapse sequence of photobleaching experiments on GFP-fascin (B) and GFP-actin (C). Fluorescence of GFP-fascin recovered quickly, whereas GFP-actin did not recover. Instead, the bleached zone moved with retrograde flow. Bars, 1 μm. Time given in seconds. (D) Recovery profile of bleached zone over time course of FRAP experiment. By 6 s, half of bleached cross-links have fully exchanged with neighboring molecules. The postbleach average intensity along the filopodium matches the average intensity at the time when fluorescence has evenly distributed, or fascin has fully exchanged, suggesting that fascin turnover is primarily intrafilopodial on this time scale. (E) At longer time scales, the bleach zone recovers fully (to prebleach values), suggesting that filopodial-cytoplasmic exchange restores fluorescence to the prebleach intensity. The recovery profile is curve-fit with a double exponential function with a recovery constant for fast intrafilopodial exchange and a second recovery constant for slower filopodial–cytoplasmic exchange (see Materials and Methods). Fast and slow recovery components are shown in shaded regions, with the recovery profile for rapid intrafilopodial exchange separating the two.
Figure 2.
Figure 2.
Kinetic analysis of fluorescence recovery of fascin in filopodia reveals koff. (A) FLIP of GFP-fascin in filopodia. Fluorescence decay near the tip represents exchange of GFP-fascin with bleached and endogenous cross-links. Bars, 1 μm. Time given in seconds. (B) Plot of relative intensity versus time in both FRAP and FLIP experiments on GFP-fascin in filopodia. Relative decay of fluorescence in FLIP experiment was curve fit with a single exponential function, exp(−kofft), and directly reveals a half-time of dissociation of 6 s. The corresponding FRAP curve shows a half-time of fluorescence recovery of 6 s as well. This half time also yields the dissociation rate of fascin from actin because, assuming that the total concentration of fascin remains unchanged in the filopodium over time, the recovered fluorescence is equal to the difference between the total amount of fascin and the amount that dissociated. Therefore, the FRAP data were curve fit with the function, 1 − exp(−kofft), where koff = 0.12 s−1.
Figure 3.
Figure 3.
Fascin is dynamic in reconstituted filopodia-like bundles. (A) Profile view of perfusion chamber design. Actin–fascin bundles are tethered to nitrocellulose-coated coverslip via a biotin-neutravidin interaction. (B) Top, photobleaching of Alexa488-fascin in reconstituted filopodia-like bundles reveals rapid recovery of fluorescence. Bottom, photobleaching experiment on TMR-actin yields no fluorescence recovery. Bleached zone marked by boxes. Bar, 1 μm. Time given in seconds. (C) Recovery curves show intensity relative to prebleach value per time of the experiment for fascin and actin, with average half time of recovery for fascin of 6 s and recovery to prebleach level by 20 s. (D) Plots show the mean (circle) recovery half-times for FRAP experiments performed in vitro and in vivo, along with their respective 95% confidence intervals. The matching fast recovery kinetics for fascin in filopodia and reconstituted bundles reveal that dynamic exchange in filopodia is an intrinsic property of the fascin cross-linker.
Figure 4.
Figure 4.
Localization and dynamics of fascin mutants in filopodia. (A) Fascin wild type (WT) and phosphomutant expression patterns in N2a cells. WT and S39A are enriched in filopodia, whereas S39E shows weaker localization in filopodia. Soluble GFP localizes uniformly throughout cell. (B) The relative intensities of filopodia and cytoplasm for WT, S39A, and S39E fascin and those of soluble GFP, as measured in protruding filopodia and lamellipodia indicated in dashed outlines in A. Average relative intensity ratios, Ifil/Ilam, (circles) and 95% confidence intervals are similar and overlap for WT and S39A, whereas those for S39E and GFP are much lower and similar to each other, suggesting that S39E weakly localizes to filopodia. FRAP experiments reveal recovery of GFP-S39A fascin (C), GFP-S39E fascin (D, left), and GFP (D, right) in filopodia. Bars, 1 μm. Time given in seconds. Although FRAP leaves a distinctly visible bleached zone in the S39A experiment, it leaves nearly the whole filopodium bleached in the S39E and GFP experiments, even though the same size bleached zone was used to perform the bleaching experiments, suggesting that S39E undergoes a diffusion process similar to that of GFP in filopodia. (E) Plots show the distribution of half-times of recovery for fascin WT and mutants alongside GFP. Although recovery of S39E and GFP occur in t1/2 = 1.7 ± 0.9 s (n = 13) and t1/2 = 0.5 ± 0.3 s (n = 10), respectively, the recovery is slower and identical for WT and S39A, with average t1/2 = 6 s, suggesting that filopodial filaments are primarily bundled by dephosphorylated fascin.
Figure 5.
Figure 5.
Phospho-fascin undergoes pure diffusion in filopodia. (A) FRAP recovery curves for soluble GFP and fascin mutants S39E and S39A (symbols). Simulations of recovery data (curves) yield diffusion coefficients for GFP and S39E. Recovery data with curve-fitting for S39A follows reaction-dominant process, plotted for comparison. (B) Median values of measured diffusion coefficients for GFP (7.5 μm2/s; n = 12) and S39E (5.1 μm2/s; n = 14) plotted versus molecular weight. Given a purely diffusive motion of GFP, the Stokes–Einstein relationship predicts a diminished diffusion coefficient with increasing molecular weight that matches S39E recovery data, suggesting the phosphomimetic mutant is negligibly slowed by adhesion or small network pore size. This relationship allows for interpolation of diffusion coefficient for unlabeled fascin, yielding D = 6 μm2/s.
Figure 6.
Figure 6.
Filopodial bundles contain 1 fascin cross-link per 25–60 actin monomers in B16 cells. (A) Western blot of B16 cell lysate (in duplicate) and varying amounts of pure fascin protein. Comparison of band intensity reveals that B16 cells typically contain 100–300 nM [Fascin]. (B) Epifluorescent image of a B16 cell expressing GFP-fascin along with schematic representation of inset (C). Peripheries of cell (solid) and cytoplasm (dashed) are outlined to indicate borders of integrated intensity measurements, where Icyt+fil is the total cell intensity and Icyt is the intensity in nonfilopodial parts. (D) Percentage of fascin localized to filopodia was calculated using the expression, (Icyt+filIcyt)/Icyt+fil × 100 and plotted versus average intensity in cells for varying expression levels. The data were fit with a third order polynomial with y-intercept equal to the percentage of endogenous fascin that localizes to filopodia in wild-type, nonexpressing cells. Using this technique, we determined that ∼11% of total fascin molecules in the cell localize to filopodia, or 11–33 nM [Fascin] reside in filopodia. Comparing the fascin to actin concentration in filopodia yields a ratio of 1 fascin per 25–60 actin (Appendix B).
Figure 7.
Figure 7.
Nearly all fascin molecules (95–98%) in filopodia are bound. (A) Confocal slice of a B16 cell expressing GFP-fascin along with (B) schematic representation of the same cell. Average intensities in filopodia (sold line) and cytoplasm (dashed circle) were measured. The intensity in filopodia, Ifil, is proportional to total concentration of fascin, bound and unbound, whereas intensity in the lamellipodium, Icyt, is proportional to amount of unbound fascin in filopodia. (C) Thus, percentage of fascin bound in filopodia was calculated as (1 − Icyt)/Ifil and plotted versus average cytoplasmic intensity over a range of expression levels. Both the range and mean values for percentage of fascin bound in filopodia were fit with a second-order polynomial function, where the y-intercept yields the percentage of endogenous protein bound in filopodia of wild-type, nonexpressing cells. Using this method, we found that 95–98% of filopodial fascin is bound, with a mean value of 97%.
Figure 8.
Figure 8.
Effective fascin transport to the tips of growing filopodia require dynamic cross-links. (A) A numerical model was developed to compare the suitability of fascin delivery to tips of growing filopodia via diffusion with irreversible cross-linking (1) and dynamic cross-linking via dissociation (2). (B) Under mechanism 1, cross-linkers diffuse toward barbed-ends and attach permanently near the first available binding site (koff = 0) precluding delivery to the growing tips of moderate or long filopodia (black curves). In mechanism 2, fascin dissociation allows for cross-links to contribute farther along the filopodial length and near the tips (gray curves). (C) The percentage of occupied binding sites near the tips of 3-μm filopodia was plotted against fascin dissociation rate constants for growth rates of 1–4 μm/min. The curves reveal an increase in fascin–actin complex concentration, [FS], near tips for low rate constants, as well as a decrease at high rates due to a diminishing steady-state bound concentration (dashed curve). The peaks in the curves reflect optimal off rates for given conditions. (D) A plot of the optimal off-rate for various lengths and growth speeds show that a value of koff = 0.12 s−1 is optimal for 3-μm-long filopodia growing at 2 μm/min.
Figure 9.
Figure 9.
Illustrative model of fascin dynamics and organization in filopodia. Fascin is activated by dephosphorylation, which allows for high-affinity interaction with actin filaments in filopodia. Active fascin undergoes intrinsic dynamic exchange, which facilitates and ensures efficient remodeling of the filopodium during shape changes.
Figure 10.
Figure 10.
Rapid fascin exchange may endow filopodia with a rate-dependent response mode to mechanical stress. Schematic models depicting the behavior of fascin in filopodial bundles under different rates of deformation. (A) Fascin undergoes continuous exchange within unstressed bundles. (B) Moderate rates of fascin exchange allow for filopodia to resist rapid deformations (C) but to reorganize when stress is applied slowly. In the latter case, fascin provides little resistance against the load since cross-links rearrange faster than filaments are displaced.

References

    1. Adams J. C., Clelland J. D., Collett G. D., Matsumura F., Yamashiro S., Zhang L. Cell-matrix adhesions differentially regulate fascin phosphorylation. Mol. Biol. Cell. 1999;10:4177–4190. - PMC - PubMed
    1. Albrecht-Buehler G. Filopodia of spreading 3T3 cells. Do they have a substrate-exploring function? J. Cell Biol. 1976;69:275–286. - PMC - PubMed
    1. Anilkumar N., Parsons M., Monk R., Ng T., Adams J. C. Interaction of fascin and protein kinase Cα: a novel intersection in cell adhesion and motility. EMBO J. 2003;22:5390–5402. - PMC - PubMed
    1. Brieher W. M., Coughlin M., Mitchison T. J. Fascin-mediated propulsion of Listeria monocytogenes independent of frequent nucleation by the Arp2/3 complex. J. Cell Biol. 2004;165:233–242. - PMC - PubMed
    1. Bryan J., Kane R. E. Separation and interaction of the major components of sea urchin actin gel. J. Mol. Biol. 1978;125:207–224. - PubMed

Publication types

MeSH terms