. 2007 Aug;117(8):2133-44.
doi: 10.1172/JCI31807.

Foxo3 is required for the regulation of oxidative stress in erythropoiesis

Affiliations

Foxo3 is required for the regulation of oxidative stress in erythropoiesis

Dragan Marinkovic et al. J Clin Invest. 2007 Aug.

Abstract

Erythroid cells accumulate hemoglobin as they mature and as a result are highly prone to oxidative damage. However, mechanisms of transcriptional control of antioxidant defense in erythroid cells have thus far been poorly characterized. We observed that animals deficient in the forkhead box O3 (Foxo3) transcription factor died rapidly when exposed to erythroid oxidative stress-induced conditions, while wild-type mice showed no decreased viability. In view of this striking finding, we investigated the potential role of Foxo3 in the regulation of ROS in erythropoiesis. Foxo3 expression, nuclear localization, and transcriptional activity were all enhanced during normal erythroid cell maturation. Foxo3-deficient erythrocytes exhibited decreased expression of ROS scavenging enzymes and had a ROS-mediated shortened lifespan and evidence of oxidative damage. Furthermore, loss of Foxo3 induced mitotic arrest in erythroid precursor cells, leading to a significant decrease in the rate of in vivo erythroid maturation. We identified ROS-mediated upregulation of p21(CIP1/WAF1/Sdi1) (also known as Cdkn1a) as a major contributor to the interference with cell cycle progression in Foxo3-deficient erythroid precursor cells. These findings establish an essential nonredundant function for Foxo3 in the regulation of oxidative stress, cell cycle, maturation, and lifespan of erythroid cells. These results may have an impact on the understanding of human disorders in which ROS play a role.


Figures

Figure 1
Figure 1. High oxidative stress in Foxo3–/– erythrocytes.
(A) Kaplan Meier survival curve of wild-type and Foxo3–/– mice (n = 6 in each group) treated with a single dose of intraperitoneal injection of phenylhydrazine (PHZ; 100 mg/kg). P < 0.0001, log-rank test; 1 of 2 independent experiments is shown. (B) ROS measurement in WT and Foxo3–/– erythrocytes (note absence of any exogenously added peroxide). (C) Histogram of results from B (mean ± SEM, n = 6; **P < 0.02). (D) Protein oxidation in erythrocytes. DNPH, 2,4-dinitrophenylhydrazine. (E) Quantitative analysis of the oxidative status of WT (n = 3) and Foxo3–/– (n = 4) erythrocytes by comparison of signal intensity of lanes in D using BandScan software version 4.5 (Glyco). *P < 0.05, Student’s t test.
Figure 2
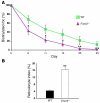
Figure 2. Reduced erythrocyte lifespan in Foxo3–/– mice.
(A) Erythrocyte lifespan was measured by in vivo biotin labeling. At day 0, 95% of erythrocytes were labeled. Animals were bled every 5 days, and the surviving labeled cells were analyzed by flow cytometry. (B) Reticulocyte index was measured in Foxo3–/– and WT mice. Results represent mean ± SEM; n = 6 in each group. *P < 0.05, **P < 0.01, Student’s t test.
Figure 3
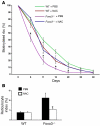
Figure 3. ROS induced shortened erythrocyte lifespan in Foxo3–/– mice.
(A) In vivo NAC therapy improves the lifespan of erythrocytes in Foxo3–/– mice. WT and Foxo3–/– mice were treated intraperitoneally with NAC (100 mg/kg) or PBS 3 times a week; after 3 weeks, erythrocytes were biotinylated in vivo and erythrocyte lifespan measured as in Figure 2, while NAC (or PBS) treatment continued for another 3 weeks. (B) Reticulocyte index was measured after 6 weeks in all mice. One of 2 independent experiments is shown. Results represent mean ± SEM, n = 6 per group; *P < 0.05.
Figure 4
Figure 4. Foxo3 expression is upregulated during erythroblast maturation.
(A) QRT-PCR analysis of Foxo1, Foxo3, and Foxo4 in embryonic and adult hematopoietic organs. Shown are representative results from 3 independent experiments performed in duplicate. (B) Western blot analysis of endogenous FoxO protein expression in the bone marrow. Protein lysates of HEK293T cells overexpressing FOXO1, FOXO3a, and FOXO4 cDNAs were used as positive controls. (C) QRT-PCR analysis of indicated transcripts from subpopulations of fetal liver isolated by flow cytometry according to their CD71 and TER119 expression. Note that expression of Foxo3 is the highest in the most mature erythroid cell subpopulation (CD71TER119+). Representative results from 3 independent experiments performed in triplicate are shown as mean ± SEM. Cells differentiate from a double CD71TER119 cell subpopulation enriched in hematopoietic progenitors, including erythroid progenitors, to CD71+TER119 cells containing mostly proerythroblasts and basophilic erythroblasts, then to CD71+TER119+ cells enriched for basophilic/polychromatophilic erythroblasts, and finally to CD71TER119+ cells consisting mostly of normoblasts. (D) Western blot analysis of Foxo3 in subpopulations of fetal liver enriched for progenitors (TER119) and for erythroid precursors (TER119+, erythroblasts) using anti-FOXO3a antibody. Anti–GATA-1 (N6) and anti–β-actin antibodies were used as controls.
Figure 5
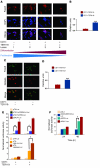
Figure 5. Foxo3 translocates to the nucleus and regulates transcription of anti-oxidant enzymes in primary fetal liver erythroblasts.
(A) Immunofluorescence staining of Foxo3 (red) in freshly isolated E14.5 fetal liver erythroid subpopulations using anti-FOXO3a antibody was performed and samples were counterstained with nuclear DAPI (blue). (B) Quantification of nuclear Foxo3 in CD71TER119 cells as compared with CD71TER119+ cells. Data were analyzed from an average of 50 cells from each subpopulation in A. (C) Foxo3 expression was investigated in nucleated, deep red fluorescing agent (DRAQ5) positive cells. DRAQ5+CD71TER119 and DRAQ5+CD71TER119+ cells were FACS sorted from E14.5 fetal liver and subjected to immunofluorescence staining using anti-FOXO3a antibody (green). (D) Quantification of results from C is shown for at least 50 cells from each subpopulation as mean ± SEM. ***P < 0.001, Student’s t test. (E) FACS-sorted erythroid precursor subpopulations CD71+TER119 and CD71+TER119+ cells were transfected with synthetic reporter containing 5 tandem repeat FoxO binding site (pTA-FoxO5BS-Luc) or mutant (pTA-FoxO5BSmut-Luc) (top panel), or a catalase luciferase reporter containing 2 FoxO binding sites (pTA-cata.mut-Luc) or mutant (pTA-catalase-Luc) (bottom panel), then cultured as previously described in the presence of Epo (2 U/ml) (28, 39), and luciferase activity was analyzed after 36 hours. EKLF reporter (pEKLF-Luc) (56) was used as a positive control. Data representative of normalized results from at least 4 independent experiments performed in triplicate are shown as mean ± SEM. **P < 0.01; P < 0.002; #P < 0.0001. (F) Transcriptional activity of Foxo3 during maturation of fetal liver erythroid precursors. TER119 fetal liver cells (enriched in progenitors) were transiently transfected with an empty luciferase reporter (pGL-3) or a SOD2 luciferase reporter containing 2 FoxO binding sites (pSod-Luc) or its mutant (pSOD-DBE12mut-Luc) and cultured as described above, and luciferase activity was determined at 24 and 48 hours. Results are shown as mean ± SEM; n = 4 for each group.
Figure 6
Figure 6. Mitotic arrest in Foxo3–/– erythroid precursor cells.
(A) Left: Flow cytometry analysis of live WT and Foxo3–/– bone marrow erythroid precursors according to their expression of CD71 and TER119. Gates I to IV depict erythroid cell populations with an increasing degree of maturation. Numbers by gates represent percentage of distribution of cells within that gate. Note decrease of Foxo3–/– mature erythroid cells (gate IV) and increase of Foxo3–/– precursors in gate II as compared with WT (representative flow cytometry analysis of 9 experiments is shown). Right: Representative analysis of cell cycle distribution in CD71+TER119+ cells (gate II) from 6 independent experiments. (B) Ratio of gate IV to gate II from A (n = 9, mean ± SEM; **P < 0.01, Student’s t test). (C) Cell cycle analysis of cells in gate II from left panel of A (n = 6, mean ± SEM; ***P < 0.001, Student’s t test) is shown. WT and Foxo3-deficient CD71+TER119+ (gate II) bone marrow erythroid cells were FACS sorted and analyzed for cell cycle distribution using Hoechst (A, right panel, and C). Percentage of cells in G1, S, and G2/M phases of cell cycle are shown (n = 6, mean ± SEM; ***P < 0.001, Student’s t test). No significant difference was found in the analysis of cell cycle of other subpopulations.
Figure 7
Figure 7. State of oxidative stress in Foxo3-deficient erythroblasts.
(A) QRT-PCR analysis of cell cycle regulator genes in freshly isolated FACS-sorted erythroblasts at an intermediary (CD71+TER119+) stage of differentiation from wild-type and Foxo3-deficient bone marrow cells. Note upregulation of p21CIP1/WAF1/Sdi1 in intermediary erythroblasts (CD71+TER119+ cells are the same as those shown in gate II of Figure 6A). (B) Left: QRT-PCR analysis of p53 expression in the same cells as in A. Right: p53 reporter luciferase activity in WT and Foxo3-deficient bone marrow TER119 cells 36 hours after transfection and in vitro culture as in Figure 5, E and F. Representative of 2 independent experiments. (C) QRT-PCR analysis of antioxidant genes in the same populations as in A. Note upregulation of p53 downstream antioxidant targets GADD45 and SESN2. Representative of 4 independent experiments performed in duplicate or more. *P < 0.05, Student’s t test.
Figure 8
Figure 8. ROS-induced upregulation of p21CIP1/WAF1/Sdi1.
TER119 bone marrow cells were cultured with or without 100 μM NAC, and the expression of p21CIP1/WAF1/Sdi1 was measured by QRT-PCR after 36 hours. *P < 0.05 Student’s t test.
Figure 9
Figure 9. Foxo3 is required for expression of antioxidant enzymes.
QRT-PCR analysis of antioxidant enzymes in bone marrow erythroblasts (TER119+) cells. GPX1, glutathione peroxidase 1. n = 3; *P < 0.05, **P < 0.02, Student’s t test.
Figure 10
Figure 10. Defective post-progenitor erythroblast response to phenylhydrazine in Foxo3–/– mice.
WT and Foxo3-deficient mice were treated with phenylhydrazine (100 mg/kg) or PBS and sacrificed 24 hours later. (A) Flow cytometry analysis of relative frequency of mature erythroblasts in the bone marrow, spleen, and blood, calculated by the ratio of mature erythroblasts (CD71TER119+) to total erythroblasts (CD71+TER119+ and CD71TER119+). n = 3 in each group; *P < 0.05, Student’s t test. (B) Measurement of ROS concentration in erythroblasts (TER119+ cells). #P < 0.01; **P < 0.001.
Figure 11
Figure 11. Model of the regulation of Foxo3 subcellular localization in erythropoiesis.
Inhibition of EpoR signaling, which includes inhibition of the PI3-kinase/AKT pathway, as a result of downregulation of EpoR on erythroblasts, coupled with accumulation of hemoglobin, may result in ROS signaling, leading to Foxo3 nuclear localization and activation.

Comment in

Similar articles

Cited by

References

    1. Beckman K.B., Ames B.N. The free radical theory of aging matures. Physiol. Rev. 1998;78:547–581. - PubMed
    1. Ito K., et al. Regulation of oxidative stress by ATM is required for self-renewal of haematopoietic stem cells. Nature. 2004;431:997–1002. - PubMed
    1. Cumming R.C., et al. Fanconi anemia group C protein prevents apoptosis in hematopoietic cells through redox regulation of GSTP1. Nat. Med. 2001;7:814–820. - PubMed
    1. Lin K., Dorman J.B., Rodan A., Kenyon C. daf-16: An HNF-3/forkhead family member that can function to double the life-span of Caenorhabditis elegans. Science. 1997;278:1319–1322. - PubMed
    1. Lehtinen M.K., et al. A conserved MST-FOXO signaling pathway mediates oxidative-stress responses and extends life span. Cell. 2006;125:987–1001. - PubMed

Publication types

MeSH terms

Substances