Clinical Trial
. 2007 Aug;117(8):2241-9.
doi: 10.1172/JCI31661.

Gammaretrovirus-mediated correction of SCID-X1 is associated with skewed vector integration site distribution in vivo

Affiliations
Clinical Trial

Gammaretrovirus-mediated correction of SCID-X1 is associated with skewed vector integration site distribution in vivo

Kerstin Schwarzwaelder et al. J Clin Invest. 2007 Aug.

Abstract

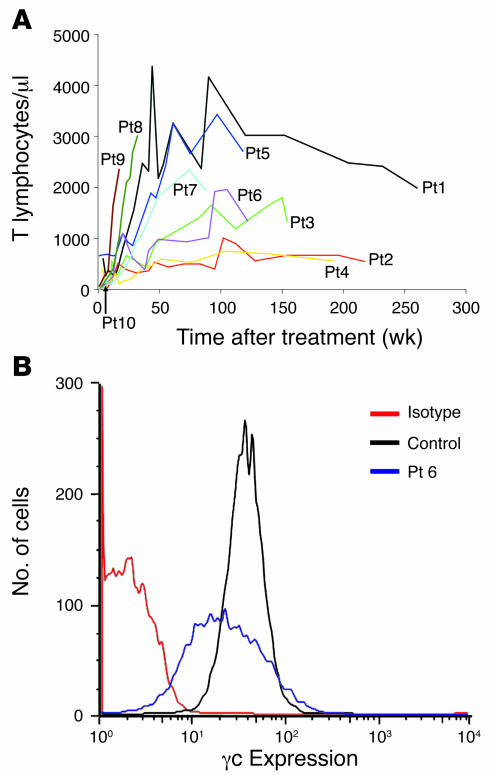
We treated 10 children with X-linked SCID (SCID-X1) using gammaretrovirus-mediated gene transfer. Those with sufficient follow-up were found to have recovered substantial immunity in the absence of any serious adverse events up to 5 years after treatment. To determine the influence of vector integration on lymphoid reconstitution, we compared retroviral integration sites (RISs) from peripheral blood CD3(+) T lymphocytes of 5 patients taken between 9 and 30 months after transplantation with transduced CD34(+) progenitor cells derived from 1 further patient and 1 healthy donor. Integration occurred preferentially in gene regions on either side of transcription start sites, was clustered, and correlated with the expression level in CD34(+) progenitors during transduction. In contrast to those in CD34(+) cells, RISs recovered from engrafted CD3(+) T cells were significantly overrepresented within or near genes encoding proteins with kinase or transferase activity or involved in phosphorus metabolism. Although gross patterns of gene expression were unchanged in transduced cells, the divergence of RIS target frequency between transduced progenitor cells and post-thymic T lymphocytes indicates that vector integration influences cell survival, engraftment, or proliferation.


Figures

Figure 1
Figure 1. Functional restoration of immunity.
(A) Lymphocyte recovery in patients after treatment in the clinical trial. CD3+ counts were obtained for each patient at regular time points after treatment. All patients demonstrated an increase in lymphocyte count, albeit varied, that was stable over time. (B) Surface expression of γc protein. Expression of γc on CD3+ T cells was determined 25 months after treatment for Pt6, who had no cell-surface γc protein before gene therapy. The isotype is a negative control, which shows levels of background fluorescence. The control, a healthy donor, demonstrates normal levels of γc expression on the cell surface.
Figure 2
Figure 2. Genomic distribution of RISs.
(A) The relationship of chromosome size, number of known genes, and RIS frequency. Values for chromosome lengths are shown as a percentage of the total genome size. Values for gene density are shown as a percentage of all genes from the genome. Values of RISs are shown as a percentage of RISs from the corresponding fraction. White bars, autosome length, which was counted twice to allow for the diploid status of hematopoietic cells (X and Y chromosomes were counted once only); light gray bars, gene density of each chromosome; medium gray bars, RISs detected in CD34+ cells from a healthy donor; dark gray bars, RISs detected in pretransplant CD34+ cells from Pt6; black bars, RIS detected in patients’ engrafted cells. (B and C) RISs location related to RefSeq genes. All mappable insertions detected in different fractions are shown as a percentage of all insertions derived from the corresponding fraction. Medium gray bars, RISs derived from transduced CD34+ cells of a healthy donor; dark gray bars, RISs derived from transduced preengraftment CD34+ cells from Pt6; black bars, RISs derived from patients’ engrafted cells. RefSeq gene, RISs in gene region. (B) RISs distribution 10 kbp up- and downstream of TSSs. Up, upstream of TSSs. (C) RISs in and near gene coding regions. RISs locations inside genes are expressed as the percentage of the overall length of each individual vector targeted gene. –5 kbp, all RISs located 5 kbp upstream of TSSs; +5 kbp, all RISs located 5 kbp downstream of RefSeq genes; Down, downstream of RefSeq genes.
Figure 3
Figure 3. Comparative analysis of vector integration and gene expression.
(A and B) MvA plots for all probesets and probesets closest to RISs in Pt1 and healthy donor. (A) RNA expression determined by Affymetrix U133A microarray of CD3/CD28-stimulated CD4+ cells of Pt1. All 22,283 probesets on the array are shown in blue. Of these, 3,173 were significantly different in Pt1 versus control (P < 0.05, adjusted Sidak step-up; red), corresponding to 1,549 upregulated and 1,624 downregulated genes. 96 probesets (65 upregulated and 16 downregulated) genes exceeded log2 fold change of 2. None of these were associated with RISs. (B) MvA plots for 200 probesets (blue) describing 134 genes closest to RISs in Pt1. Expression in 48 probesets was significantly different (red), corresponding to 17 upregulated and 19 downregulated genes. Most differences were marginal; only 5 of these probesets — describing FLJ10986 and SPTLC2 (upregulated), and ITGAL, PDCD4, and DPH5 (downregulated) — had log2 fold changes between 1.5 and 2. (C) Comparative analysis of gene expression in CD34+ cells stimulated under transduction conditions and RISs retrieved from engrafted CD3+ cells in 5 patients and (D) comparison of gene expression in engrafted CD4+ T cells and RISs retrieved from corresponding CD3+ population of Pt1. There was a significant correlation between gene expression and the number of integration events, as expected, although less pronounced. All genes on the array were organized into 10 bins according to expression levels, and the number of integrations was calculated for each category. The number of genes in each expression level category assuming uniform random distribution is shown by horizontal line.

Comment in

References

    1. Cavazzana-Calvo M., et al. Gene therapy of human severe combined immunodeficiency (SCID)-X1 disease. Science. 2000;288:669–672. - PubMed
    1. Gaspar H.B., et al. Gene therapy of X-linked severe combined immunodeficiency by use of a pseudotyped gammaretroviral vector. Lancet. . 2004;364:2181–2187. - PubMed
    1. Hacein-Bey-Abina S., et al. Sustained correction of X-linked severe combined immunodeficiency by ex vivo gene therapy. N. Engl. J. Med. 2002;346:1185–1193. - PubMed
    1. Aiuti A., et al. Correction of ADA-SCID by stem cell gene therapy combined with nonmyeloablative conditioning. Science. 2002;296:2410–2413. - PubMed
    1. Aiuti A., et al. Immune reconstitution in ADA-SCID after PBL gene therapy and discontinuation of enzyme replacement. Nat. Med. 2002;8:423–425. - PubMed

Publication types

MeSH terms