Clinical Trial
. 2007 Aug;117(8):2260-7.
doi: 10.1172/JCI31680.

Impaired basolateral sorting of pro-EGF causes isolated recessive renal hypomagnesemia

Affiliations
Clinical Trial

Impaired basolateral sorting of pro-EGF causes isolated recessive renal hypomagnesemia

Wouter M Tiel Groenestege et al. J Clin Invest. 2007 Aug.

Abstract

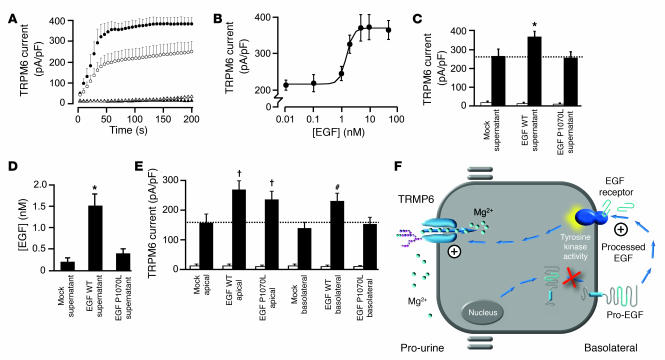
Primary hypomagnesemia constitutes a rare heterogeneous group of disorders characterized by renal or intestinal magnesium (Mg(2+)) wasting resulting in generally shared symptoms of Mg(2+) depletion, such as tetany and generalized convulsions, and often including associated disturbances in calcium excretion. However, most of the genes involved in the physiology of Mg(2+) handling are unknown. Through the discovery of a mutation in the EGF gene in isolated autosomal recessive renal hypomagnesemia, we have, for what we believe is the first time, identified a magnesiotropic hormone crucial for total body Mg(2+) balance. The mutation leads to impaired basolateral sorting of pro-EGF. As a consequence, the renal EGFR is inadequately stimulated, resulting in insufficient activation of the epithelial Mg(2+) channel TRPM6 (transient receptor potential cation channel, subfamily M, member 6) and thereby Mg(2+) loss. Furthermore, we show that colorectal cancer patients treated with cetuximab, an antagonist of the EGFR, develop hypomagnesemia, emphasizing the significance of EGF in maintaining Mg(2+) balance.


Figures

Figure 1
Figure 1. Molecular analysis of EGF.
(A) Pedigree of the family in which specific members suffer from IRH. Filled symbols represent affected individuals, half-filled symbols are heterozygous for the mutation C3209T, and open symbols represent clinically unaffected family members not screened for the mutation. Slash marks indicate deceased individuals, and double lines show consanguinity. (B) Schematic representation of the critical interval between polymorphic markers D4S2623 and D4S1575 on chromosome 4q and the intron-exon structure of the EGF gene, depicting the identified mutation. The position of the polymorphic markers is indicated by vertical bars. The horizontal arrow below the schematical boxed representation of EGF depicted between the polymorphic markers indicates the localization and orientation of the EGF gene. Cen, centromeric; tel, telomeric. (C) Genomic mutation sequence analysis of EGF in wild-type, heterozygous, and affected individuals. The mutated nucleotide and resulting amino-acid change is shown under the affected individual’s sequence. The black bar under that sequence indicates the mutated codon. The black bars under the sequences of the WT and heterozygous specify codon 1070 of EGF. The affected individuals both have a homozygous mutation C3209T in exon 22, resulting in the amino acid substitution P1070L. (D) Schematic model of pro-EGF, which resides as a type I membrane protein at the plasma membrane. The position of the P1070L mutation is depicted. (E) Sequence homology analysis of juxtamembrane domain and flanking residues. P1070 is strongly conserved among different species and forms the second proline of a basolateral PXXP sorting motif. The indicated colors represent functional conservation of the amino acids: red, small plus hydrophobic; blue, acidic; magenta, basic; green, hydroxyl plus amine plus basic; gray, others. TM, transmembrane domain.
Figure 2
Figure 2. Expression profiling of EGF and EGFR.
(A) The expression of EGF and EGFR mRNA was determined by RT-PCR on various human tissues. Signals for EGF were detected in, e.g., kidney, salivary gland, prostate, and cerebrum whereas no signals were detected in the adrenal gland, cerebellum, liver, lung, and placenta. The EGFR showed a ubiquitous expression pattern since PCR amplification products were obtained in all tissues tested. hEGF, human EGF; hEGFR, human EGFR. (B) Immunohistochemical analysis of EGF (green) and thiazide-sensitive sodium chloride cotransporter (NCC, red) in rat kidney sections (upper panel, overview of a cortical region; lower panel, magnified image of an immunopositive tubule). EGF colocalized with NCC, a marker for the DCT. Original magnification, ×180 (B, top panels); ×360 (B, bottom panels).
Figure 3
Figure 3. Electrophysiological analysis of pro-EGF and pro-EGF–P1070L on TRPM6 channel activity.
(A) Average time course of outward (at +80 mV) current densities from HEK293 cells transfected with TRPM6 in control conditions (open circles) and after EGF treatment (30 minutes, 10 nM, filled circles) in comparison with mock-transfected cells without EGF treatment (triangles) and after EGF stimulation (filled triangles). n = 17–20. (B) Dose-response curve of EGF-induced current in TRPM6-transfected HEK293 cells indicating half maximal effective concentration of 1.7 nM. n = 11–14. (C) Histogram presenting the current densities at +80 mV of TRPM6-transfected cells (200 seconds after establishment of the whole-cell configuration) treated with mock (mock), pro-EGF (EGF WT) or pro-EGF–P1070L (EGF-P1070L) supernatant. All treatments were performed for 30 minutes at 37°C. White bars indicate experimental conditions in which HEK293 cells were transfected with mock DNA whereas black bars indicate HEK293 cells transfected with TRPM6. Asterisk indicates significance in comparison with nontreated TRPM6-transfected cells. P = 0.024; n = 6. (D) Supernatants of mock-, pro-EGF–, or pro-EGF–P1070L–transfected HEK293 cells were analyzed by ELISA. Asterisk indicates mock and pro-EGF–P1070L supernatant were significantly different from EGF supernatant. P = 0.006; n = 4. (E) Histogram summarizing the current density (pA/pF) at +80 mV (200 seconds after break-in) of HEK293 cells treated with the apical or basolateral supernatant of MDCK cells stably transfected with either wild-type pro-EGF, pro-EGF–P1070L, or mock DNA (30 minutes, 37°C). White bars indicate experimental conditions in which HEK293 cells were transfected with mock DNA whereas black bars indicate HEK293 cells transfected with TRPM6. Crosses indicate significance in comparison with the mock treatment at the apical side (wild-type pro-EGF apical, P = 0.0001, n = 6; pro-EGF–P1070L apical, P = 0.029, n = 6), and pound symbol represents significance in comparison with the mock treatment at the basolateral side (wild-type pro-EGF basolateral P = 0.031, n = 6). (F) Schematic model illustrating how pro-EGF–P1070L mutation results in IRH. The pro-EGF–P1070L mutation leads to impaired basolateral sorting of pro-EGF, resulting in abrogated stimulation of the EGFR localized at the basolateral membrane. Activation of the EGFR in DCT by EGF is necessary to prevent renal Mg2+ wasting by stimulation of the epithelial Mg2+ channel TRPM6.
Figure 4
Figure 4. Effect of cetuximab treatment on Mg2+ balance and TRPM6 activity.
(A) Changes in serum Mg2+ levels from baseline over time during cetuximab therapy are shown for 20 colorectal cancer patients. Solid lines represent individual linear regression lines of the data points for each individual patient. Open symbols denote end of treatment. (B) Cetuximab treatment leads to renal Mg2+ loss and hypomagnesemia. Serum samples and urine (over a 24-hour period) was collected from 8 patients at baseline in normomagnesemic conditions (open circles), 12 patients on cetuximab treatment in hypomagnesemic conditions (filled circles), and patients (V3, V4) with IRH (triangles), then analyzed for FE of Mg2+. FE Mg2+ was plotted against the serum Mg2+ concentrations for the tested individuals. Hypomagnesemia in combination with an inappropriately high excretion of Mg2+ was observed in patients with the P1070L mutation as well as in individuals treated with cetuximab. Large circles represent the averaged values of patients on cetuximab treatment (filled) and patients at baseline in normomagnesemic conditions (open). Asterisk indicates a significant difference in serum (Mg2+) compared with that in control patients. P = 0.001; n = 8–12. (C) Histogram depicting the current densities at +80 mV of TRPM6-transfected cells that were exposed for 30 minutes to EGF, cetuximab, or EGF in combination with cetuximab. Cross indicates a significant difference compared with nontreated (CTRL) HEK293-TRPM6 cells. P < 0.026; n = 6.

Comment in

References

    1. Dai L.J., et al. Magnesium transport in the renal distal convoluted tubule. Physiol. Rev. 2001;81:51–84. - PubMed
    1. Ferment O., Garnier P.E., Touitou Y. Comparison of the feedback effect of magnesium and calcium on parathyroid hormone secretion in man. J. Endocrinol. 1987;113:117–122. - PubMed
    1. Cholst I.N., et al. The influence of hypermagnesemia on serum calcium and parathyroid hormone levels in human subjects. N. Engl. J. Med. 1984;310:1221–1225. - PubMed
    1. Konrad M., Schlingmann K.P., Gudermann T. Insights into the molecular nature of magnesium homeostasis. Am. J. Physiol. Renal. Physiol. 2004;286:F599–F605. - PubMed
    1. Agus Z.S. Hypomagnesemia. J. Am. Soc. Nephrol. 1999;10:1616–1622. - PubMed

Publication types

MeSH terms