

Diagnosis of basal cell carcinoma by infrared spectroscopy of whole blood samples applying soft independent modeling class analogy
- PMID: 17671793
- PMCID: PMC12160841
- DOI: 10.1007/s00432-007-0286-x
Diagnosis of basal cell carcinoma by infrared spectroscopy of whole blood samples applying soft independent modeling class analogy
Erratum in
- J Cancer Res Clin Oncol. 2007 Dec;133(12):1023
Abstract
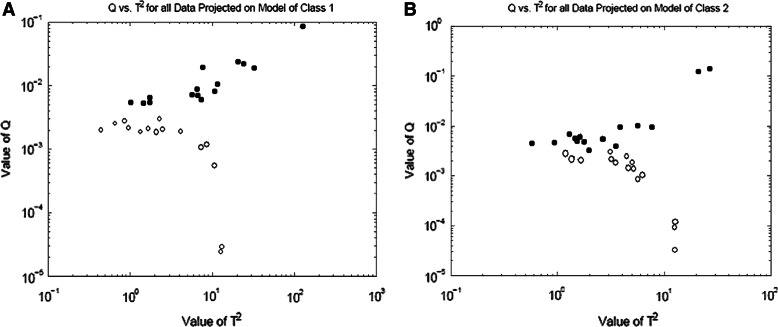
Attenuated total reflectance-Fourier transform infrared (ATR-FTIR) spectroscopy was applied to discriminate the blood samples obtained from healthy people and those with basal cell carcinoma, demonstrating high accuracy while soft independent modeling class analogy (SIMCA) chemometric technique is benefited. It was aimed to classify the normal case and cancer case blood samples through the use of ATR-FTIR spectroscopy as a rapid method while the sample preparation is so easy in comparison with the common pathologic methods. A total of 72 blood samples, including 32 cancer and 40 normal cases, were analyzed in 1,800-900 cm(-1) spectral region. Results showed 97.6% of accuracy being compared with the current clinical methods. Research results were exemplified with comparable data of other classification methods such as principal component analysis (PCA) and Cluster analysis. The residual errors in prediction (REP) of calibration model for normal and cancerous groups in SIMCA method were 0.00362 and 0.00343, respectively.
Figures


References
-
- Argov S, Ramesh J, Salman A, Sinelnikov I, Goldstein J, Guterman H, Mordechai S (2002) Diagnostic potential of Fourier-transform infrared micro spectroscopy and advanced computational methods in colon cancer patients. J Biomed Opt 7:1–5 - PubMed
-
- Argov S, Sahu RK, Bernshtain E, Salman A, Shohat G, Zelig U, Mordechai S (2004) Inflammatory bowel diseases as an intermediate stage between normal and cancer: a FTIR-microspectroscopy approach. Biopolymers 75:384–392 - PubMed
-
- Barbareschi M, Girlando S, Cristofolini P, Cristofolini M, Togni R, Boi S (1992) p53 protein expression in basal cell carcinomas. Histopathology 21:579–581 - PubMed
-
- Beebe KR, Pell RJ, Seasholtz MB (1998) Chemometrics: a practical guide. Wiley, New York
-
- Benedetti E, Papineschi F, Vergamini P, Consolini R, Spremolla G (1984) Analytical infrared spectral differences between human normal and leukaemic cells (CLL)-I. Leuk Res 8:483–489 - PubMed
Publication types
MeSH terms
LinkOut - more resources
Full Text Sources
Other Literature Sources
Medical
Miscellaneous
