

Differentiation of adrenal adenoma and nonadenoma in unenhanced CT: new optimal threshold value and the usefulness of size criteria for differentiation
- PMID: 17673844
- PMCID: PMC2627166
- DOI: 10.3348/kjr.2007.8.4.328
Differentiation of adrenal adenoma and nonadenoma in unenhanced CT: new optimal threshold value and the usefulness of size criteria for differentiation
Abstract
Objective: To determine the optimal threshold for the attenuation values in unenhanced computed tomography (CT) and assess the value of the size criteria for differentiating between an adrenal adenoma and a nonadenoma.
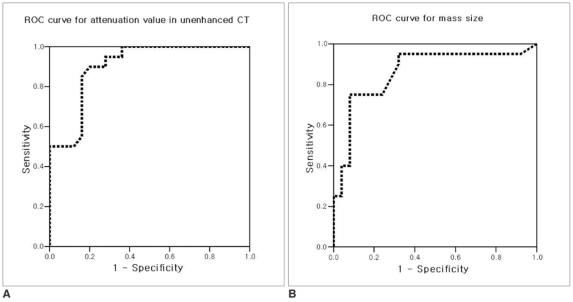
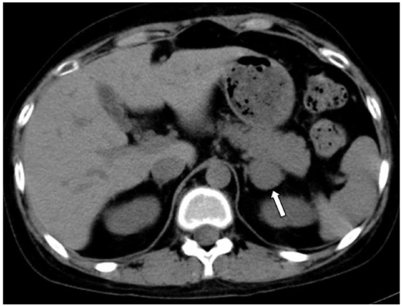
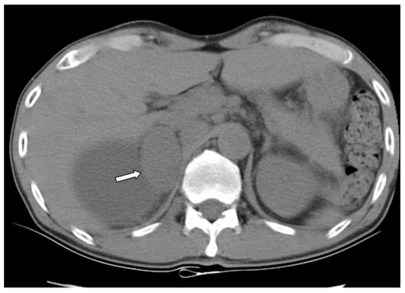
Materials and methods: The unenhanced CT images of 45 patients at our institution, who underwent a surgical resection of an adrenal masses between January 2001 and July 2005, were retrospectively reviewed. Forty-five adrenal masses included 25 cortical adenomas, 12 pheochromocytomas, three lymphomas, and five metastases confirmed by pathology were examined. The CT images were obtained at a slice thickness of 2 mm to 3 mm. The mAs were varied from 100 to 160 and 200 to 280, while the 120 KVp was maintained in all cases. The mean attenuation values of an adrenal adenoma and nonadenoma were compared using an unpaired t test. The sensitivity, specificity, positive predictive value, negative predictive value, and accuracy at thresholds of 10 HU, 20 HU, and 25 HU were compared. The diagnostic accuracy according to the size criteria from 2 cm to 6 cm was also compared.
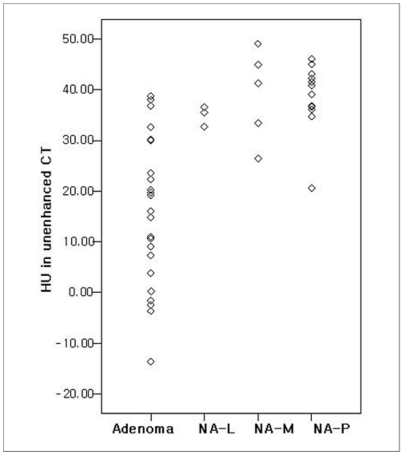
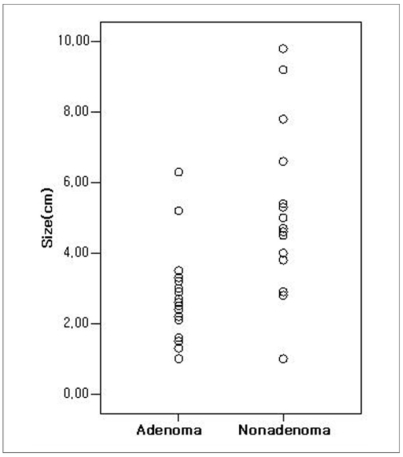
Results: The twenty-five adenomas showed significantly lower (p < 0.05) attenuation values (mean+/-SD; 16.3+/-14.9) than the nonadenomas (38.1+/-6.8). Nineteen (90%) of the 20 nonadenomas had attenuation values ranging from 30 to 50 HU. The sensitivity, specificity, positive predictive value, negative predictive value, and accuracy for diagnosing adenomas were 36%, 100%, 100%, 56%, and 64%, respectively, at a threshold of 10 HU; 60%, 100%, 100%, 67%, and 78%, respectively, at a threshold of 20 HU; and 72%, 95%, 95%, 73%, and 82%, respectively, at a threshold of 25 HU. The adenomas had a significantly (p < 0.05) smaller diameter (2.44+/-1.24 cm) than the nonadenomas (5.09+/-2.37 cm). The size criteria using a diameter of 4-6 cm showed a sensitivity > 90% but a specificity < 70%. Size criteria of 2 or 3 cm had a high specificity of 100% and 80% but a low sensitivity of 20% and 60%.
Conclusion: The threshold attenuation values of 20 or 25 HU in the unenhanced CT appear optimal for discriminating an adrenal adenoma from a nonadenoma. The size criteria are of little value in differentiating adrenal masses because of their low specificity or low sensitivity.
Figures
Similar articles
-
Differentiation of adrenal adenomas from nonadenomas using CT attenuation values.AJR Am J Roentgenol. 1996 Mar;166(3):531-6. doi: 10.2214/ajr.166.3.8623622. AJR Am J Roentgenol. 1996. PMID: 8623622
-
Differentiation of adrenal adenomas from nonadenomas using CT histogram analysis method: a prospective study.Eur J Radiol. 2010 Mar;73(3):643-51. doi: 10.1016/j.ejrad.2008.12.010. Epub 2009 Jan 22. Eur J Radiol. 2010. PMID: 19167179
-
Adrenocortical carcinomas and adrenal pheochromocytomas: mass and enhancement loss evaluation at delayed contrast-enhanced CT.Radiology. 2005 Feb;234(2):479-85. doi: 10.1148/radiol.2342031876. Radiology. 2005. PMID: 15671003
-
[Differential diagnosis of space-occupying adrenal masses].Rofo. 1999 Oct;171(4):269-78. doi: 10.1055/s-1999-252. Rofo. 1999. PMID: 10598161 Review. German.
-
[CT and MRI in the differential diagnosis of lesions of the adrenal gland].Med Klin (Munich). 2004 Aug 15;99(8):447-52. doi: 10.1007/s00063-004-1054-1. Med Klin (Munich). 2004. PMID: 15309273 Review. German.
Cited by
-
The value of signal intensity on T1-weighted chemical shift magnetic resonance imaging combined with proton magnetic resonance spectroscopy for the diagnosis of adrenal adenomas.Radiol Bras. 2020 Mar-Apr;53(2):86-94. doi: 10.1590/0100-3984.2019.0095. Radiol Bras. 2020. PMID: 32336823 Free PMC article.
-
Radiomics: a new tool to differentiate adrenocortical adenoma from carcinoma.BJS Open. 2021 Jan 8;5(1):zraa061. doi: 10.1093/bjsopen/zraa061. BJS Open. 2021. PMID: 33677483 Free PMC article.
-
Likelihood ratio of computed tomography characteristics for diagnosis of malignancy in adrenal incidentaloma: systematic review and meta-analysis.J Diabetes Metab Disord. 2016 Apr 21;15:12. doi: 10.1186/s40200-016-0224-z. eCollection 2015. J Diabetes Metab Disord. 2016. PMID: 27104171 Free PMC article. Review.
-
MANAGEMENT OF ENDOCRINE DISEASE: Imaging for the diagnosis of malignancy in incidentally discovered adrenal masses: a systematic review and meta-analysis.Eur J Endocrinol. 2016 Aug;175(2):R51-64. doi: 10.1530/EJE-16-0461. Epub 2016 Jun 2. Eur J Endocrinol. 2016. PMID: 27257145 Free PMC article.
-
Distinguishing adrenal adenomas from non-adenomas with multidetector CT: evaluation of percentage washout values at a short time delay triphasic enhanced CT.Br J Radiol. 2019 Feb;92(1094):20180429. doi: 10.1259/bjr.20180429. Epub 2018 Nov 28. Br J Radiol. 2019. PMID: 30433826 Free PMC article.
References
-
- Kloos RT, Gross MD, Francis IR, Korobkin M, Shapiro B. Incidentally discovered adrenal masses. Endocr Rev. 1995;16:460–484. - PubMed
-
- Caplan RH, Strutt PJ, Wickus GG. Subclinical hormone secretion by incidentally discovered adrenal masses. Arch Surg. 1994;129:291–296. - PubMed
-
- Herrera MF, Grant CS, van Heerden JA, Sheedy PF, Ilstrup DM. Incidentally discovered adrenal tumors: an institutional perspective. Surgery. 1991;110:1014–1021. - PubMed
-
- Kokko JP, Brown TC, Berman MM. Adrenal adenoma and hypertension. Lancet. 1967;1:468–470. - PubMed
-
- Dobbie JW. Adrenocortical nodular hyperplasia: the ageing adrenal. J Pathol. 1969;99:1–18. - PubMed
MeSH terms
LinkOut - more resources
Full Text Sources
Medical
