Identification of the PIP2-binding site on Kir6.2 by molecular modelling and functional analysis
- PMID: 17673911
- PMCID: PMC1952224
- DOI: 10.1038/sj.emboj.7601809
Identification of the PIP2-binding site on Kir6.2 by molecular modelling and functional analysis
Abstract
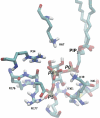
ATP-sensitive potassium (K(ATP)) channels couple cell metabolism to electrical activity by regulating K(+) fluxes across the plasma membrane. Channel closure is facilitated by ATP, which binds to the pore-forming subunit (Kir6.2). Conversely, channel opening is potentiated by phosphoinositol bisphosphate (PIP(2)), which binds to Kir6.2 and reduces channel inhibition by ATP. Here, we use homology modelling and ligand docking to identify the PIP(2)-binding site on Kir6.2. The model is consistent with a large amount of functional data and was further tested by mutagenesis. The fatty acyl tails of PIP(2) lie within the membrane and the head group extends downwards to interact with residues in the N terminus (K39, N41, R54), transmembrane domains (K67) and C terminus (R176, R177, E179, R301) of Kir6.2. Our model suggests how PIP(2) increases channel opening and decreases ATP binding and channel inhibition. It is likely to be applicable to the PIP(2)-binding site of other Kir channels, as the residues identified are conserved and influence PIP(2) sensitivity in other Kir channel family members.
Figures


Similar articles
-
Functional analysis of a structural model of the ATP-binding site of the KATP channel Kir6.2 subunit.EMBO J. 2005 Jan 26;24(2):229-39. doi: 10.1038/sj.emboj.7600487. Epub 2005 Jan 13. EMBO J. 2005. PMID: 15650751 Free PMC article.
-
Activation of adenosine triphosphate-sensitive potassium channels by acyl coenzyme A esters involves multiple phosphatidylinositol 4,5-bisphosphate-interacting residues.Mol Endocrinol. 2004 Mar;18(3):679-86. doi: 10.1210/me.2003-0431. Epub 2003 Dec 23. Mol Endocrinol. 2004. PMID: 14694085
-
Regulation of the ATP-sensitive K channel Kir6.2 by ATP and PIP(2).J Mol Cell Cardiol. 2005 Jul;39(1):71-7. doi: 10.1016/j.yjmcc.2004.11.018. J Mol Cell Cardiol. 2005. PMID: 15978904 Review.
-
Localization of the ATP/phosphatidylinositol 4,5 diphosphate-binding site to a 39-amino acid region of the carboxyl terminus of the ATP-regulated K+ channel Kir1.1.J Biol Chem. 2002 Dec 20;277(51):49366-73. doi: 10.1074/jbc.M208679200. Epub 2002 Oct 14. J Biol Chem. 2002. PMID: 12381730
-
Activation of inwardly rectifying potassium (Kir) channels by phosphatidylinosital-4,5-bisphosphate (PIP2): interaction with other regulatory ligands.Prog Biophys Mol Biol. 2007 Jul;94(3):320-35. doi: 10.1016/j.pbiomolbio.2006.04.001. Epub 2006 Jun 19. Prog Biophys Mol Biol. 2007. PMID: 16837026 Review.
Cited by
-
From Bench to Biomolecular Simulation: Phospholipid Modulation of Potassium Channels.J Mol Biol. 2021 Aug 20;433(17):167105. doi: 10.1016/j.jmb.2021.167105. Epub 2021 Jun 15. J Mol Biol. 2021. PMID: 34139216 Free PMC article. Review.
-
A Self-Assembling Lipidic Peptide and Selective Partial V2 Receptor Agonist Inhibits Urine Production.Sci Rep. 2020 Apr 29;10(1):7269. doi: 10.1038/s41598-020-64070-9. Sci Rep. 2020. PMID: 32350300 Free PMC article.
-
Caveolae, ion channels and cardiac arrhythmias.Prog Biophys Mol Biol. 2008 Oct-Nov;98(2-3):149-60. doi: 10.1016/j.pbiomolbio.2009.01.012. Epub 2009 Jan 30. Prog Biophys Mol Biol. 2008. PMID: 19351512 Free PMC article. Review.
-
The dynamic interplay of PIP2 and ATP in the regulation of the KATP channel.J Physiol. 2022 Oct;600(20):4503-4519. doi: 10.1113/JP283345. Epub 2022 Sep 23. J Physiol. 2022. PMID: 36047384 Free PMC article.
-
Energetics and location of phosphoinositide binding in human Kir2.1 channels.J Biol Chem. 2013 Jun 7;288(23):16726-16737. doi: 10.1074/jbc.M113.452540. Epub 2013 Apr 5. J Biol Chem. 2013. PMID: 23564459 Free PMC article.
References
-
- Ashcroft FM (2006) Ion channels and disease: from molecule to malady. Nature 440: 440–447 - PubMed
-
- Baukrowitz T, Schulte U, Oliver D, Herlitze S, Krauter T, Tucker SJ, Ruppersberg JP, Fakler B (1998) PIP2 and PIP as determinants for ATP inhibition of KATP channels. Science 282: 1141–1144 - PubMed
-
- Berendsen HJC, Postma JPM, van Gunsteren WF, DiNola A, Haak JR (1984) Molecular dynamics with coupling to an external bath. J Chem Phys 81: 3684–3690
Publication types
MeSH terms
Substances
Grants and funding
LinkOut - more resources
Full Text Sources
Other Literature Sources

