. 2007 Jul;18(6-7):473-81.
doi: 10.1007/s00335-007-9045-1. Epub 2007 Aug 3.

The polymorphism architecture of mouse genetic resources elucidated using genome-wide resequencing data: implications for QTL discovery and systems genetics

Affiliations

The polymorphism architecture of mouse genetic resources elucidated using genome-wide resequencing data: implications for QTL discovery and systems genetics

Adam Roberts et al. Mamm Genome. 2007 Jul.

Abstract

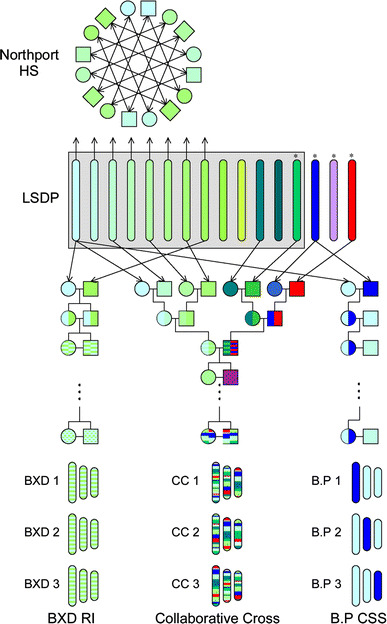
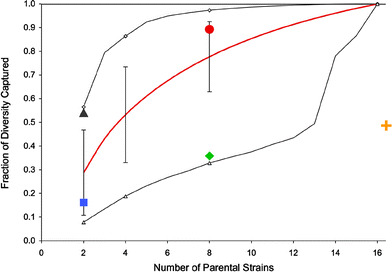
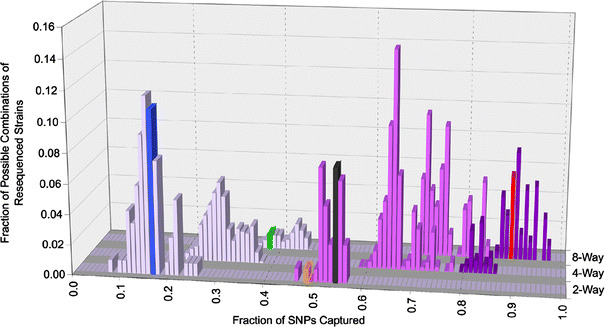
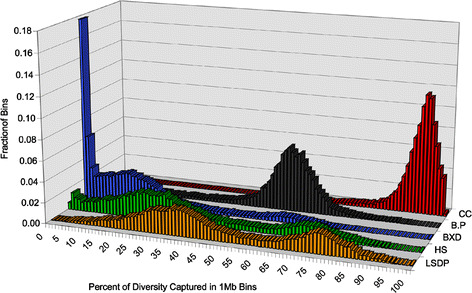
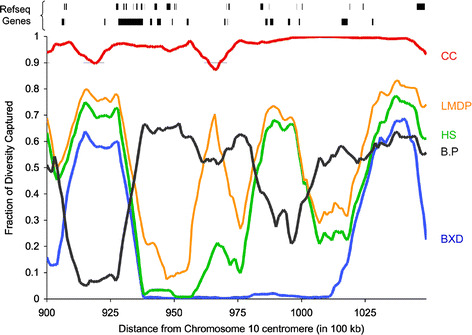
Mouse genetic resources include inbred strains, recombinant inbred lines, chromosome substitution strains, heterogeneous stocks, and the Collaborative Cross (CC). These resources were generated through various breeding designs that potentially produce different genetic architectures, including the level of diversity represented, the spatial distribution of the variation, and the allele frequencies within the resource. By combining sequencing data for 16 inbred strains and the recorded history of related strains, the architecture of genetic variation in mouse resources was determined. The most commonly used resources harbor only a fraction of the genetic diversity of Mus musculus, which is not uniformly distributed thus resulting in many blind spots. Only resources that include wild-derived inbred strains from subspecies other than M. m. domesticus have no blind spots and a uniform distribution of the variation. Unlike other resources that are primarily suited for gene discovery, the CC is the only resource that can support genome-wide network analysis, which is the foundation of systems genetics. The CC captures significantly more genetic diversity with no blind spots and has a more uniform distribution of the variation than all other resources. Furthermore, the distribution of allele frequencies in the CC resembles that seen in natural populations like humans in which many variants are found at low frequencies and only a minority of variants are common. We conclude that the CC represents a dramatic improvement over existing genetic resources for mammalian systems biology applications.


Figures

Fig. 1
Fig. 1
Parental strains and derivation of five major types of mouse genetic resources. Each of the sequenced strains is shown in a different color depending on the origin. The four wild-derived strains, denoted by asterisks, are CAST/EiJ (M. m. cataneus) in red, PWD/PhJ (M. m. muculus) in blue, MOLF/EiJ (M. m. molossinus) in purple, and WSB/EiJ (M. m. domesticus) in green. The remaining 12 classical laboratory strains are shown in green reflecting the predominant contribution of the M. m. domesticus subspecies to these strains (Yang et al. 2007). The shade of green denotes the different origin of the classical strains, with the darker shades denoting strains of Swiss origin (FVB/NJ and NOD/LtJ), the yellow-green denoting a strain of Asian origin (KK/HlJ), and intermediate shade denoting Castle or C57-related strains (129S1/SvImJ, A/J, AKR/J, BALB/cBy, C3H/HeJ, DBA/2J, BTBR T + tf/J, and NZW/LacJ) (Beck et al. 2000). The figure also shows schematically the derivation process for five types of resources, recombinant inbred lines (BXD); chromosome substitution strains (B.P), Collaborative Cross (CC), heterogeneous stocks (Northport HS), and laboratory strain diversity panel (LSDP)
Fig. 2
Fig. 2
Genetic diversity captured as a function of the number of parental strains. Depicted are the ranges of genetic diversity that can be captured in resources with varying numbers of contributing parental strains based on the NIEHS resequencing data. The red line represents the average diversity captured and vertical bars represent the standard deviation. Open diamonds and open triangles represent the maximum and minimum diversity captured by 2, 4, 8, and 16 parental strains, respectively. In addition, the diversity captured in the BXD RI (blue square), the B.P CSS (gray triangle), the Northport HS (green diamond), the Collaborative Cross (red circle), and the LSDP (orange cross) is shown
Fig. 3
Fig. 3
Genetic diversity captured as a function of the number and origin of parental strains. The individual diversity captured by every possible combination of two, four, and eight parental strains that can be generated among the sequenced strains is shown. The increasing number of subspecies (1–3) represented among the parental strains is denoted by an increasingly darker shade of purple. The diversity captured in the model resources is shown in their respective color as described in Fig. 2 (BXD RI, blue; B.P CSS, gray; Northport HS, green; LSDP, orange; CC, red). The LSDP is shown in the two-way cross for simplicity since there are more than eight strains involved
Fig. 4
Fig. 4
Frequency distribution of the genetic diversity captured in 1-Mb intervals across the entire genome. The percent of total SNPs captured in each interval was calculated for each resource before plotting the frequencies of total bins capturing similar levels of variation. The color scheme and the abbreviations are as described in Fig. 2 (BXD RI, blue; B.P CSS, gray; Northport HS, green; LSDP, orange; CC, red)
Fig. 5
Fig. 5
Genetic diversity captured in consecutive intervals in a 15-Mb region on mouse chromosome 10. The distribution of diversity captured by each resource is shown. Plots are generated from 1-Mb windows with 0.9-Mb overlap on mouse chromosome 10 from position 90 Mb to position 105 Mb. The location of Refseq genes is also shown (top). The color scheme and the abbreviations are as described in Fig. 2 (BXD RI, blue; B.P CSS, gray; Northport HS, green; LSDP, orange; CC, red)
Fig. 6
Fig. 6
Minor allele frequency distribution. The frequency distribution of the minor SNPs in four equal quintiles is shown. The approximate frequency of human SNPs is shown in pink along with an additional class for SNPs with a minor allele frequency of zero (i.e., SNPs that are not informative in a given resource or those present at less than 0.01 frequency in humans) (Kruglyak and Nickerson 2001). The color scheme and the abbreviations are as described in Fig. 2 (BXD RI, blue; B.P CSS, gray; Northport HS, green; LSDP, orange; CC, red)

Similar articles

Cited by

References

    1. Bailey DW. Recombinant-inbred strains. An aid to finding identity, linkage, and function of histocompatibility and other genes. Transplantation. 1971;11(3):325–327. doi: 10.1097/00007890-197103000-00013. - DOI - PubMed
    1. Beck JA, Lloyd S, Hafezparast M, Lennon-Pierce M, Eppig JT, et al. Genealogies of mouse inbred strains. Nat Genet. 2000;24(1):23–25. doi: 10.1038/71641. - DOI - PubMed
    1. Bogue MA, Grubb SC. The Mouse Phenome Project. Genetica. 2004;122(1):71–74. doi: 10.1007/s10709-004-1438-4. - DOI - PubMed
    1. Broman KW. The genomes of recombinant inbred lines. Genetics. 2005;169(2):1133–1146. doi: 10.1534/genetics.104.035212. - DOI - PMC - PubMed
    1. Churchill GA, Airey DC, Allayee H, Angel JM, Attie AD, et al. The Collaborative Cross, a community resource for the genetic analysis of complex traits. Nat Genet. 2004;36(11):1133–1137. doi: 10.1038/ng1104-1133. - DOI - PubMed

Publication types

LinkOut - more resources