

Binary imaging analysis for comprehensive quantitative histomorphometry of peripheral nerve
- PMID: 17675163
- PMCID: PMC2587177
- DOI: 10.1016/j.jneumeth.2007.06.018
Binary imaging analysis for comprehensive quantitative histomorphometry of peripheral nerve
Abstract
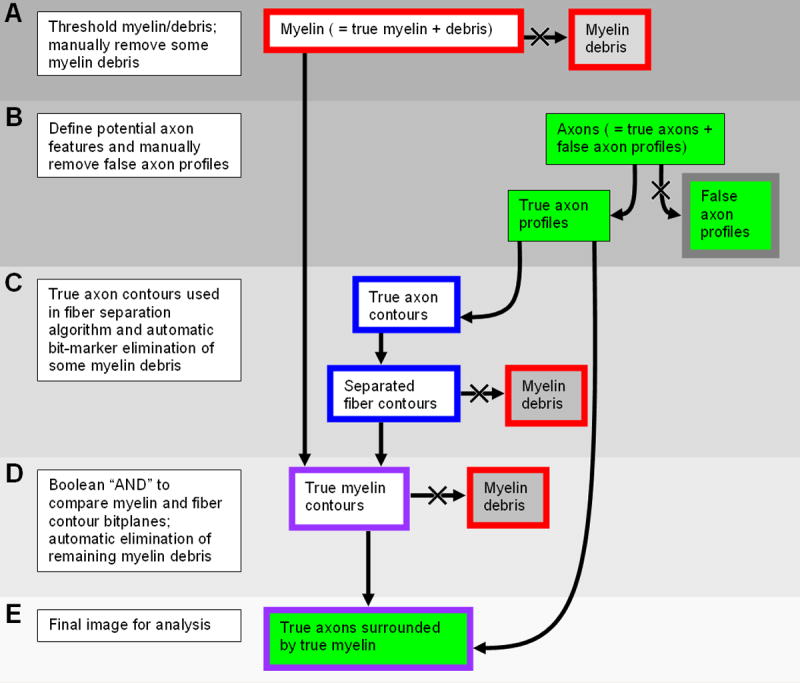
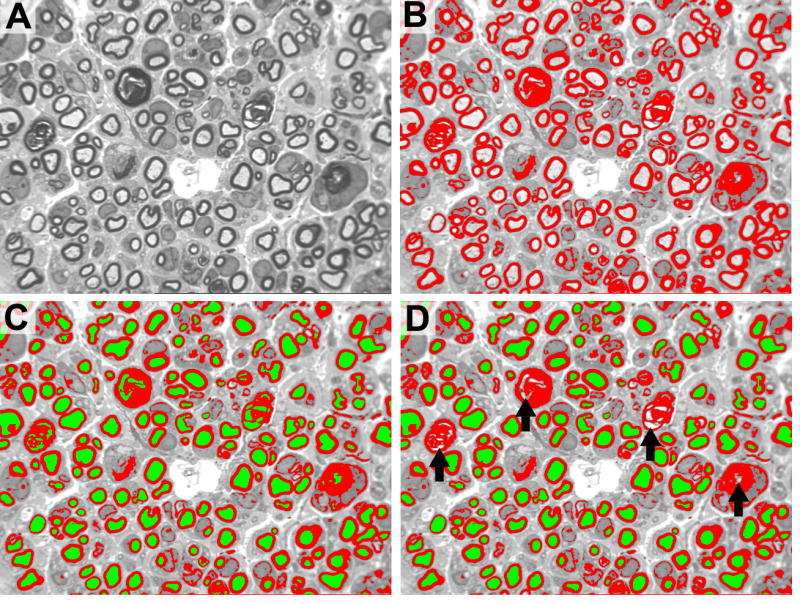
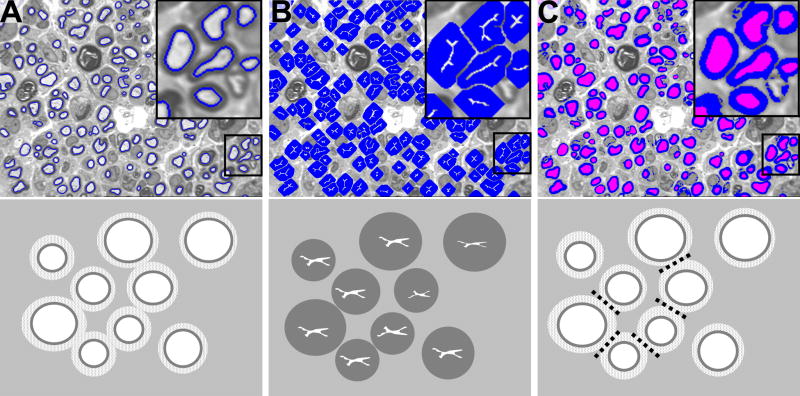
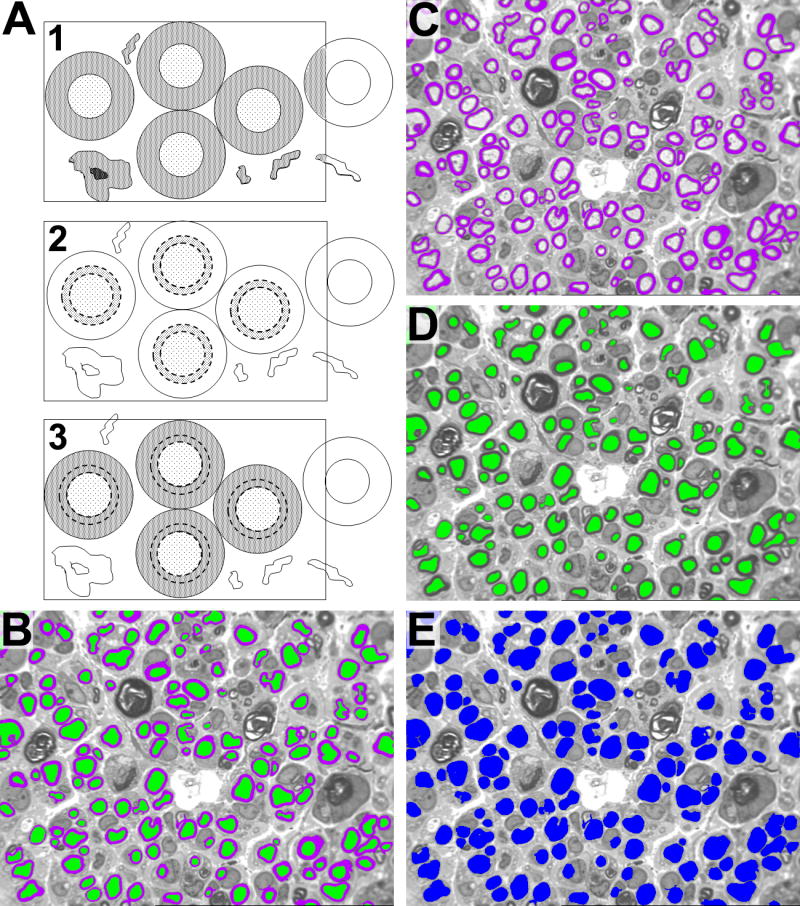
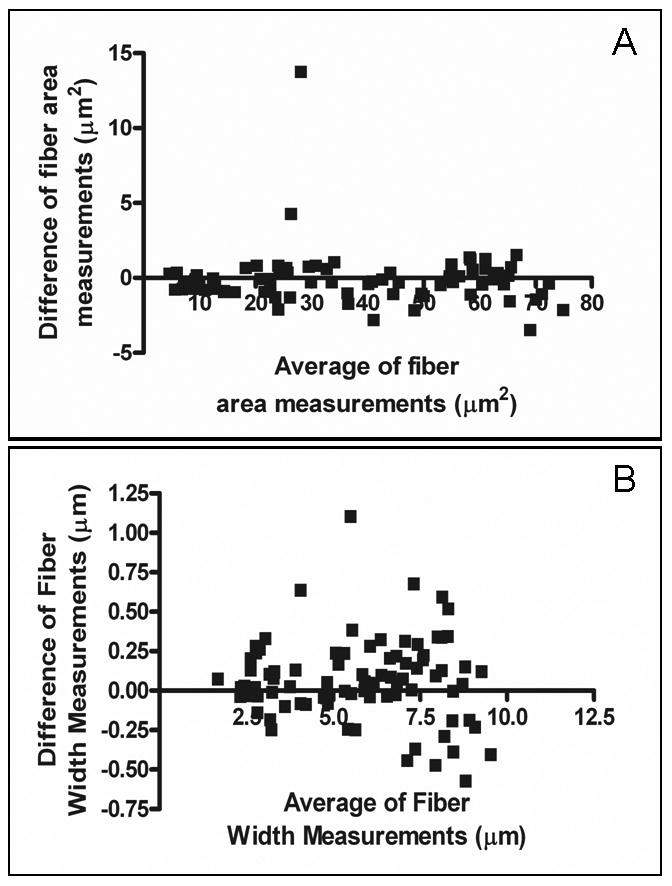
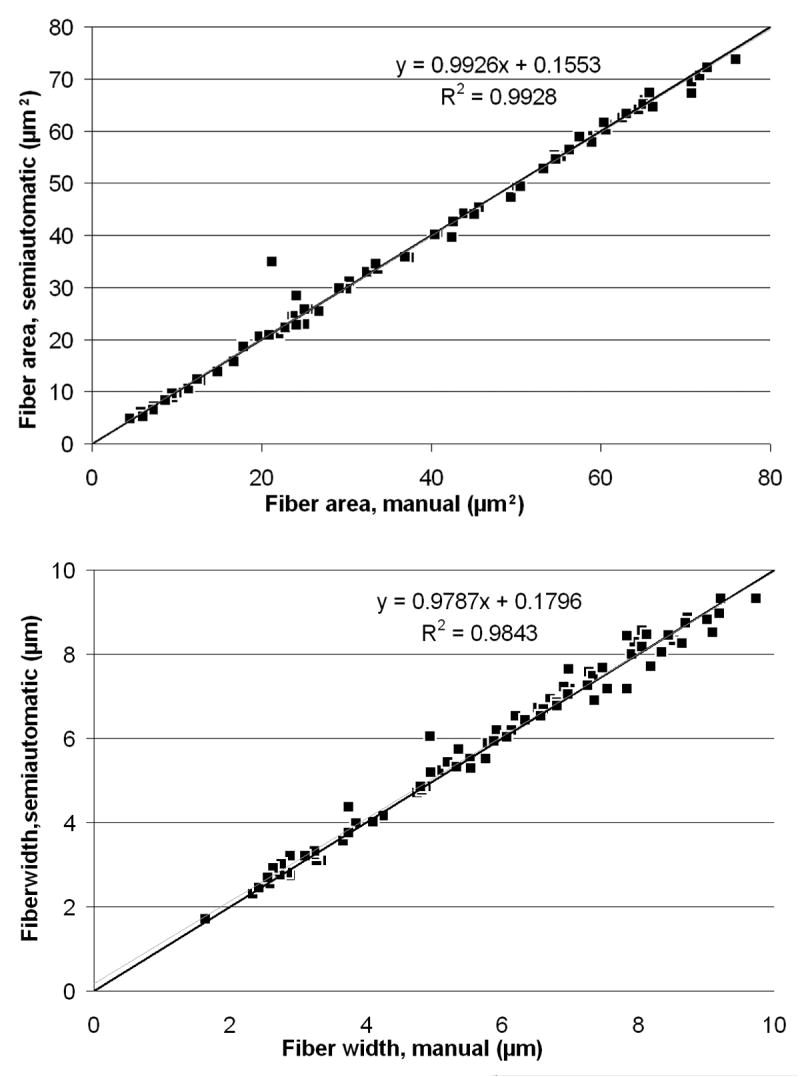
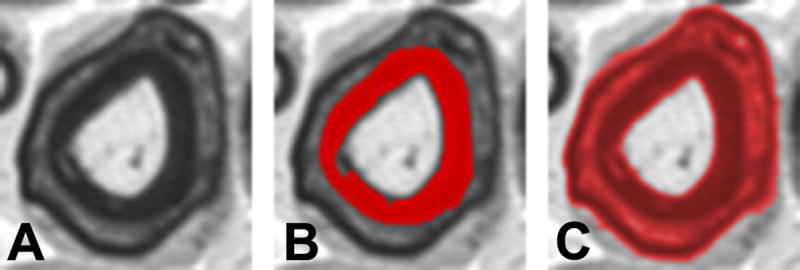
Quantitative histomorphometry is the current gold standard for objective measurement of nerve architecture and its components. Many methods still in use rely heavily upon manual techniques that are prohibitively time consuming, predisposing to operator fatigue, sampling error, and overall limited reproducibility. More recently, investigators have attempted to combine the speed of automated morphometry with the accuracy of manual and semi-automated methods. Systematic refinements in binary imaging analysis techniques combined with an algorithmic approach allow for more exhaustive characterization of nerve parameters in the surgically relevant injury paradigms of regeneration following crush, transection, and nerve gap injuries. The binary imaging method introduced here uses multiple bitplanes to achieve reproducible, high throughput quantitative assessment of peripheral nerve. Number of myelinated axons, myelinated fiber diameter, myelin thickness, fiber distributions, myelinated fiber density, and neural debris can be quantitatively evaluated with stratification of raw data by nerve component. Results of this semi-automated method are validated by comparing values against those obtained with manual techniques. The use of this approach results in more rapid, accurate, and complete assessment of myelinated axons than manual techniques.
Figures
Similar articles
-
Transcardial perfusion versus immersion fixation for assessment of peripheral nerve regeneration.J Neurosci Methods. 2009 Nov 15;184(2):303-9. doi: 10.1016/j.jneumeth.2009.08.019. Epub 2009 Aug 31. J Neurosci Methods. 2009. PMID: 19723541
-
Automatic identification and quantitative morphometry of unstained spinal nerve using molecular hyperspectral imaging technology.Neurochem Int. 2012 Dec;61(8):1375-84. doi: 10.1016/j.neuint.2012.09.018. Epub 2012 Oct 8. Neurochem Int. 2012. PMID: 23059447
-
AFM combines functional and morphological analysis of peripheral myelinated and demyelinated nerve fibers.Neuroimage. 2007 Oct 1;37(4):1218-26. doi: 10.1016/j.neuroimage.2007.06.007. Epub 2007 Jun 16. Neuroimage. 2007. PMID: 17689984
-
[Characteristics of the functional organization of myelinated nerve fibers and axon-Schwann interactions in the peripheral nervous system of vertebrates].Usp Fiziol Nauk. 1987 Oct-Dec;18(4):37-55. Usp Fiziol Nauk. 1987. PMID: 2447708 Review. Russian. No abstract available.
-
Histomorphometry in Peripheral Nerve Regeneration: Comparison of Different Axon Counting Methods.J Surg Res. 2021 Dec;268:354-362. doi: 10.1016/j.jss.2021.06.060. Epub 2021 Aug 14. J Surg Res. 2021. PMID: 34403855
Cited by
-
Aberrant Schwann cell lipid metabolism linked to mitochondrial deficits leads to axon degeneration and neuropathy.Neuron. 2013 Mar 6;77(5):886-98. doi: 10.1016/j.neuron.2013.01.012. Neuron. 2013. PMID: 23473319 Free PMC article.
-
Supercharge nerve transfer to enhance motor recovery: a laboratory study.J Hand Surg Am. 2013 Mar;38(3):466-77. doi: 10.1016/j.jhsa.2012.12.020. Epub 2013 Feb 5. J Hand Surg Am. 2013. PMID: 23391355 Free PMC article.
-
Finely Tuned Temporal and Spatial Delivery of GDNF Promotes Enhanced Nerve Regeneration in a Long Nerve Defect Model.Tissue Eng Part A. 2015 Dec;21(23-24):2852-64. doi: 10.1089/ten.TEA.2015.0311. Tissue Eng Part A. 2015. PMID: 26466815 Free PMC article.
-
Histologic, Molecular, and Clinical Evaluation of Explanted Breast Prostheses, Capsules, and Acellular Dermal Matrices for Bacteria.Aesthet Surg J. 2015 Aug;35(6):653-68. doi: 10.1093/asj/sjv017. Aesthet Surg J. 2015. PMID: 26229126 Free PMC article.
-
Mechanism-based combination treatment dramatically increases therapeutic efficacy in murine globoid cell leukodystrophy.J Neurosci. 2015 Apr 22;35(16):6495-505. doi: 10.1523/JNEUROSCI.4199-14.2015. J Neurosci. 2015. PMID: 25904800 Free PMC article.
References
-
- Atchabahian A, Genden EM, Mackinnon SE, Doolabh VB, Hunter DA. Regeneration Through Long Nerve Grafts In The Swine Model. Microsurgery. 1998;18:379–382. - PubMed
-
- Auer RN. Automated nerve fibre size and myelin sheath measurement using microcomputer-based digital image analysis: theory, method and results. J Neurosci Methods. 2004 Mar;51(2):229–38. - PubMed
-
- Brenner MJ, Lowe JB, Fox IK, Mackinnon SE, Hunter DA, Darcy MD, Duncan JR, Wood P, Mohanakumar T. Effects of Schwann Cells and Donor Antigen on Long-nerve Allograft Regeneration. Microsurgery. 2004;24:1–10. - PubMed
-
- Costa AF, Mascarenhas ND, De Andrade Netto ML. Cell Nuclei Segmentation in Noisy Images Using Morphological Watersheds. Proc SPIE. 1997;3164:314–324.
-
- Dorph-Petersen KA, Gundersen HJ, Jensen EB. Non-uniform systematic sampling in stereology. J Microsc. 2000 Nov;200(2):148–57. - PubMed
Publication types
MeSH terms
Grants and funding
LinkOut - more resources
Full Text Sources
Other Literature Sources
Miscellaneous
