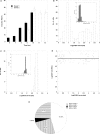
Chromosome-specific and noisy IFNB1 transcription in individual virus-infected human primary dendritic cells
- PMID: 17675303
- PMCID: PMC1976463
- DOI: 10.1093/nar/gkm557
Chromosome-specific and noisy IFNB1 transcription in individual virus-infected human primary dendritic cells
Abstract
The induction of interferon beta (IFNB1) is a key event in the antiviral immune response. We studied the role of transcriptional noise in the regulation of the IFNB1 locus in primary cultures of human dendritic cells (DCs), which are important 'first responders' to viral infection. In single cell assays, IFNB1 mRNA expression in virus-infected DCs showed much greater cell-to-cell variation than that of a housekeeping gene, another induced transcript and viral RNA. We determined the contribution of intrinsic noise by measuring the allelic origin of transcripts in each cell and found that intrinsic noise is a very significant part of total noise. We developed a stochastic model to investigate the underlying mechanisms. We propose that the surprisingly high levels of IFNB1 transcript noise originate from the complexity of IFNB1 enhanceosome formation, which leads to a range up to many minutes in the differences within each cell in the time of activation of each allele.
Figures


Similar articles
-
Power-laws in interferon-B mRNA distribution in virus-infected dendritic cells.Biophys J. 2009 Oct 7;97(7):1984-9. doi: 10.1016/j.bpj.2009.05.067. Biophys J. 2009. PMID: 19804729 Free PMC article.
-
Single-cell analysis shows that paracrine signaling by first responder cells shapes the interferon-β response to viral infection.Sci Signal. 2015 Feb 10;8(363):ra16. doi: 10.1126/scisignal.2005728. Sci Signal. 2015. PMID: 25670204
-
A common polymorphism in the caspase recruitment domain of RIG-I modifies the innate immune response of human dendritic cells.J Immunol. 2010 Jul 1;185(1):424-32. doi: 10.4049/jimmunol.0903291. Epub 2010 May 28. J Immunol. 2010. PMID: 20511549 Free PMC article.
-
Role of cell-to-cell variability in activating a positive feedback antiviral response in human dendritic cells.PLoS One. 2011 Feb 8;6(2):e16614. doi: 10.1371/journal.pone.0016614. PLoS One. 2011. PMID: 21347441 Free PMC article.
-
Differential type I interferon activation and susceptibility of dendritic cell populations to porcine arterivirus.Immunology. 2007 Feb;120(2):217-29. doi: 10.1111/j.1365-2567.2006.02493.x. Epub 2006 Nov 20. Immunology. 2007. PMID: 17116172 Free PMC article.
Cited by
-
Human Dendritic Cell Response Signatures Distinguish 1918, Pandemic, and Seasonal H1N1 Influenza Viruses.J Virol. 2015 Oct;89(20):10190-205. doi: 10.1128/JVI.01523-15. Epub 2015 Jul 29. J Virol. 2015. PMID: 26223639 Free PMC article.
-
Of Keeping and Tipping the Balance: Host Regulation and Viral Modulation of IRF3-Dependent IFNB1 Expression.Viruses. 2020 Jul 7;12(7):733. doi: 10.3390/v12070733. Viruses. 2020. PMID: 32645843 Free PMC article. Review.
-
Single-Cell Monitoring of Activated Innate Immune Signaling by a d2eGFP-Based Reporter Mimicking Time-Restricted Activation of IFNB1 Expression.Front Cell Infect Microbiol. 2022 Jan 18;11:784762. doi: 10.3389/fcimb.2021.784762. eCollection 2021. Front Cell Infect Microbiol. 2022. PMID: 35118008 Free PMC article.
-
Loss of Sendai virus C protein leads to accumulation of RIG-I immunostimulatory defective interfering RNA.J Gen Virol. 2017 Jun;98(6):1282-1293. doi: 10.1099/jgv.0.000815. Epub 2017 Jun 20. J Gen Virol. 2017. PMID: 28631605 Free PMC article.
-
Integrated modeling and analysis of intracellular and intercellular mechanisms in shaping the interferon response to viral infection.PLoS One. 2017 Oct 11;12(10):e0186105. doi: 10.1371/journal.pone.0186105. eCollection 2017. PLoS One. 2017. PMID: 29020068 Free PMC article.
References
-
- Kawai T, Akira S. Innate immune recognition of viral infection. Nat. Immunol. 2006;7:131–137. - PubMed
-
- Theofilopoulos AN, Baccala R, Beutler B, Kono DH. Type I interferons (alpha/beta) in immunity and autoimmunity. Annu. Rev. Immunol. 2005;23:307–336. - PubMed
-
- Covert MW, Leung TH, Gaston JE, Baltimore D. Achieving stability of lipopolysaccharide-induced NF-kappaB activation. Science. 2005;309:1854–1857. - PubMed
-
- Munshi N, Agalioti T, Lomvardas S, Merika M, Chen G, Thanos D. Coordination of a transcriptional switch by HMGI(Y) acetylation. Science. 2001;293:1133–1136. - PubMed
Publication types
MeSH terms
Substances
Grants and funding
LinkOut - more resources
Full Text Sources
Other Literature Sources

