Fluorescence depolarization studies of filamentous actin analyzed with a genetic algorithm
- PMID: 17675344
- PMCID: PMC2025662
- DOI: 10.1529/biophysj.107.107920
Fluorescence depolarization studies of filamentous actin analyzed with a genetic algorithm
Abstract
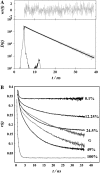
A new method, in which a genetic algorithm was combined with Brownian dynamics and Monte Carlo simulations, was developed to analyze fluorescence depolarization data collected by the time-correlated single photon-counting technique. It was applied to studies of BODIPY-labeled filamentous actin (F-actin). The technique registered the local order and reorienting motions of the fluorophores, which were covalently coupled to cysteine 374 (C374) in actin and interacted by electronic energy migration within the actin polymers. Analyses of F-actin samples composed of different fractions of labeled actin molecules revealed the known helical organization of F-actin, demonstrating the usefulness of this technique for structure determination of complex protein polymers. The distance from the filament axis to the fluorophore was found to be considerably less than expected from the proposed position of C374 at a high filament radius. In addition, polymerization experiments with BODIPY-actin suggest a 25-fold more efficient signal for filament formation than pyrene-actin.
Figures


Similar articles
-
Rotational movement of formins evaluated by using single-molecule fluorescence polarization.Methods Enzymol. 2014;540:73-94. doi: 10.1016/B978-0-12-397924-7.00005-4. Methods Enzymol. 2014. PMID: 24630102
-
Size distribution of linear and helical polymers in actin solution analyzed by photon counting histogram.Biophys J. 2007 Mar 15;92(6):2162-71. doi: 10.1529/biophysj.106.098871. Epub 2006 Dec 15. Biophys J. 2007. PMID: 17172301 Free PMC article.
-
A conformational change in F-actin when myosin binds: fluorescence resonance energy transfer detects an increase in the radial coordinate of Cys-374.Biochemistry. 1997 Jun 17;36(24):7353-60. doi: 10.1021/bi962588l. Biochemistry. 1997. PMID: 9200683
-
Rotational motions of macro-molecules by single-molecule fluorescence microscopy.Acc Chem Res. 2005 Jul;38(7):583-93. doi: 10.1021/ar040137k. Acc Chem Res. 2005. PMID: 16028893 Review.
-
Unusual characteristics of ciliate actins.Int Microbiol. 2001 Sep;4(3):167-74. doi: 10.1007/s10123-001-0032-1. Int Microbiol. 2001. PMID: 11820435 Review.
Cited by
-
In vivo imaging of the actin polymerization state with two-photon fluorescence anisotropy.Biophys J. 2012 Mar 7;102(5):1204-14. doi: 10.1016/j.bpj.2012.01.031. Epub 2012 Mar 6. Biophys J. 2012. PMID: 22404943 Free PMC article.
-
The crystal structure of the C-terminus of adseverin reveals the actin-binding interface.Proc Natl Acad Sci U S A. 2009 Aug 18;106(33):13719-24. doi: 10.1073/pnas.0812383106. Epub 2009 Aug 4. Proc Natl Acad Sci U S A. 2009. PMID: 19666531 Free PMC article.
References
-
- Dickerson, R. E. 1964. X-Ray Analysis and Protein Structure. Academic Press, New York.
-
- Blundell, T. L., and L. N. Johnson. 1976. Protein Crystallography. Academic Press, London.
-
- Clore, G. M., and A. M. Gronenborn. 1993. Topics in Molecular and Structural Biology. The Macmillan Press, London.
-
- Wütrich, K. 1986. NMR of Proteins and Nucleic Acids. Wiley, New York.
-
- Van der Meer, B. W., G. Coker III, and S.-Y. S. Chen. 1994. Resonance Energy Transfer: Theory and Data. VCH Publishers, New York.
Publication types
MeSH terms
Substances
LinkOut - more resources
Full Text Sources

