. 2007 Sep;17(9):1378-88.
doi: 10.1101/gr.6375007. Epub 2007 Aug 3.

Quantification of the synaptosomal proteome of the rat cerebellum during post-natal development

Affiliations

Quantification of the synaptosomal proteome of the rat cerebellum during post-natal development

Daniel B McClatchy et al. Genome Res. 2007 Sep.

Abstract

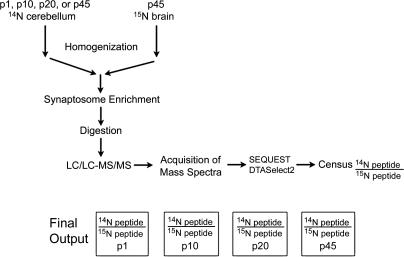
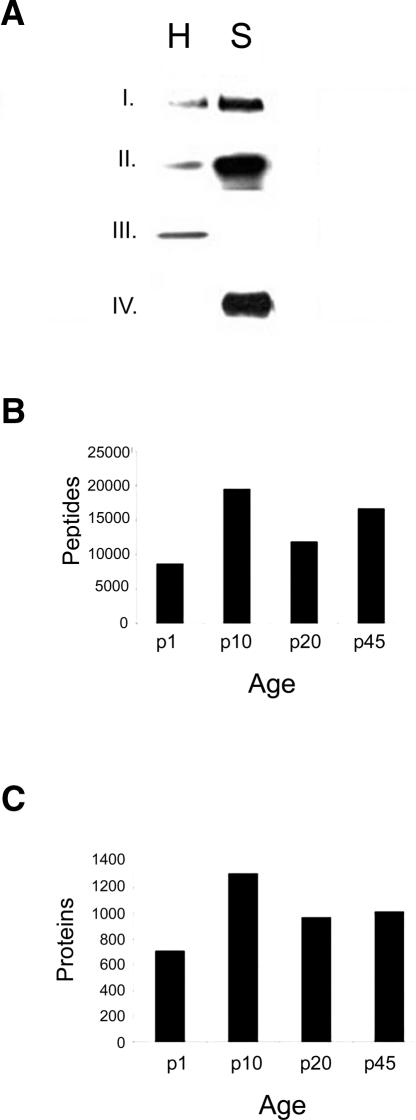
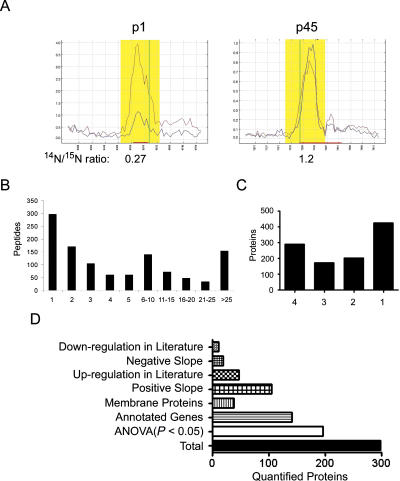
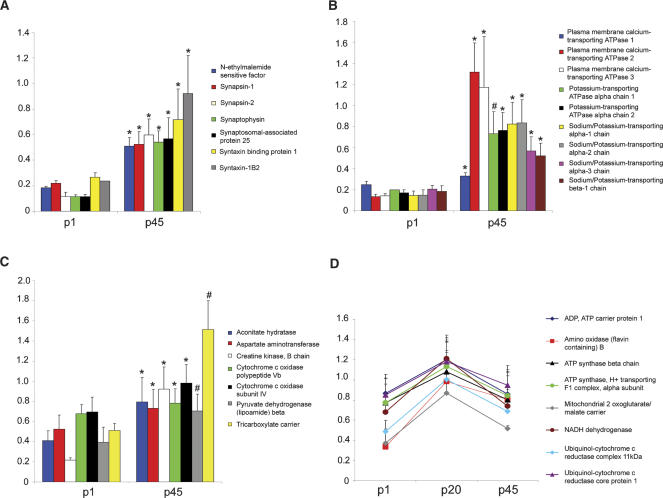
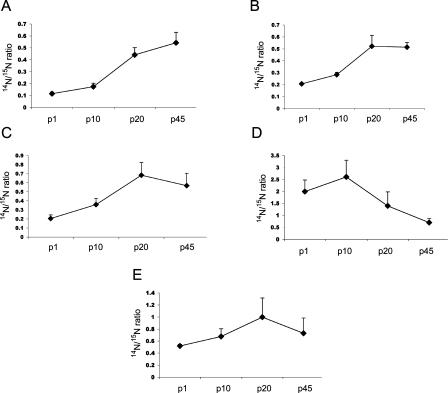
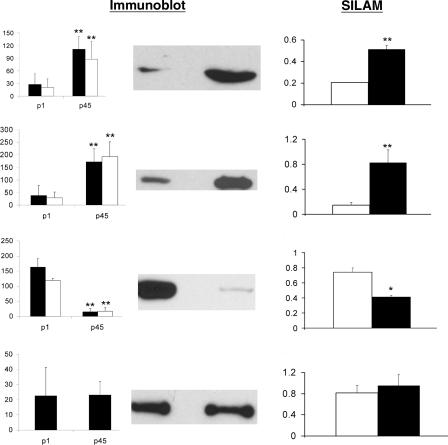
Large-scale proteomic analysis of the mammalian brain has been successfully performed with mass spectrometry techniques, such as Multidimensional Protein Identification Technology (MudPIT), to identify hundreds to thousands of proteins. Strategies to efficiently quantify protein expression levels in the brain in a large-scale fashion, however, are lacking. Here, we demonstrate a novel quantification strategy for brain proteomics called SILAM (Stable Isotope Labeling in Mammals). We utilized a (15)N metabolically labeled rat brain as an internal standard to perform quantitative MudPIT analysis on the synaptosomal fraction of the cerebellum during post-natal development. We quantified the protein expression level of 1138 proteins in four developmental time points, and 196 protein alterations were determined to be statistically significant. Over 50% of the developmental changes observed have been previously reported using other protein quantification techniques, and we also identified proteins as potential novel regulators of neurodevelopment. We report the first large-scale proteomic analysis of synaptic development in the cerebellum, and we demonstrate a useful quantitative strategy for studying animal models of neurological disease.


Figures

Figure 1.
Figure 1.
Experimental outline. Cerebella were dissected and homogenized from unlabeled (14N) rats at p1, p10, p20, or p45. Homogenates were then mixed in a 1:1 ratio with total brain homogenate from a 15N p45 rat. The synaptosomal fraction was isolated from each mixture, and then this fraction was digested with proteinase K. One hundred micrograms from each developmental period was analyzed three times by MudPIT for a total of 300 μg for each developmental period. From the mass spectra, proteins were identified by SEQUEST, and the 14N/15N ratio for each identified peptide was calculated by Census. The peptide ratios for each protein were compared between the developmental periods.
Figure 2.
Figure 2.
Western blot analysis and protein identification of the synaptosomal fraction. (A) To verify the enrichment of the synaptosomes, we performed Western blot analysis with known synaptic markers. We observed a dramatic increase in the immunoreactivity of synapsin-1 (I, presynaptic marker) and PSD-95 (II, postsynaptic marker) in the synaptosomal fraction (S) compared with unfractionated homogenate (H). In addition, we also observe an increase in the immunoreactivity of cytochrome c oxidase (IV, mitochondria marker) in the synaptosomal fraction consistent with the synaptic localization of mitochondria. We, however, observed more immunoreactivity of H3 histone (III) in the homogenate consistent with its localization in the nucleus and not in the synapses. In this study, we identified 4001 proteins (C) and 56,684 peptides (B).
Figure 3.
Figure 3.
Quantitation of the synaptosomal proteome. (A) The Census graphical output for the peptide, MRAPPGAPEKQPAPGDAYGDA, from synaptophysin. The peptide elution peak is highlighted in yellow, and red line represents the 15N-labeled peptide, while the blue line represents 14N peptide. The Y-axis is relative intensity, and the X-axis is time. In the p1 sample, the 14N peptide is less intense than the 15N peptide, but the same peptide in the p45 sample is more intense than the 15N peptide. Census calculated the 14N/15N ratios as 0.27(p1) and 1.2(p45) consistent with the well-documented increase in synaptophysin during post-natal development. (B) Organizing the results as the number of quantified peptides per protein demonstrates 74% of the proteins were quantified with two or more peptides. In C, the X-axis represents the number of developmental periods in which a protein was quantified. (D) We performed ANOVA analysis on proteins that were quantified in at least three developmental periods, which was 298 proteins. One hundred ninety-six proteins were determined to have a statistical significant change in expression during development, and 141 of these proteins have annotated genes. We further analyzed these 141 proteins with an additional statistical test to determine if there is a statistically significant (P < 0.05) linear change of protein expression. We observed 105 proteins with positive slope and 19 proteins with a negative slope during development.
Figure 4.
Figure 4.
Altered expression of different classes of proteins during post-natal development. The expression of proteins essential for neurotransmission (A) and ATPases (B) significantly increased from p1 to p45. The expression of mitochondrial proteins exhibited two distinct trends in expression during post-natal development. The expression of some mitochondrial proteins significantly increased from p1 to p45 (C), while the expression of other mitochondrial proteins significantly increased from p1 to p20 but then the expression decreased dramatically (D). After the change in protein expression was determined significant in an ANOVA analysis, a Bonferroni post-hoc test was performed. The significant difference in 14N/15N ratios between p1 and p45 for the Bonferroni post-hoc test are represented for A, B, and C by * (P-value < 0.001) and # (P-value < 0.01). The significant difference in 14N/15N ratios between p1 and p20 for the Bonferroni post-hoc test in D are as follows: ADP, ATP carrier protein 1, ATP synthase beta chain, ATP synthase, H+ transporting, mitochondrial F1 complex, alpha subunit, isoform 1, NADH dehydrogenase, and Ubiquinol-cytochrome c reductase core protein I had P-values < 0.001, and Amine oxidase [flavin-containing] B, Mitochondrial 2-oxoglutarate/malate carrier protein, and Ubiquinol-cytochrome c reductase complex 11-kDa protein had P-values < 0.05. There was no significant difference detected for any of the proteins between the 14N/15N ratios between p1 and p45 in D. The Y-axis represents 14N/15N ratio.
Figure 5.
Figure 5.
Time course of protein expression during post-natal development. We identified significant linear trends of synaptic proteins during four developmental time points. (A) synaptophysin (P < 0.0001, P-value of linear trend post-hoc test), (B) GluR2 (P < 0.0001), (C) Na+/K+ ATPase alpha-1 (P < 0.0001), (D) eEF1A1 (P < 0.0001), and (E) eEF1A2 (P < 0.0007).
Figure 6.
Figure 6.
Comparison of Western blot and mass spectrometry analysis. We probed the synaptosomal fraction with different antibodies to confirm our quantitative mass spectrometry results. Immunoblot analysis was performed twice on three different synaptosomal fractions from p1 and p45, and the intensity of the immunoreactivity was measured. A representative immunoblot is shown for each antibody tested, and a bar graph with the immunoreactivity measurements from the synaptosomal preparations (black). N = 6 for each development period for each antibody. The Y-axis represents mean pixel intensity. Proteins that demonstrated a significant change in immunoreactivity in the synaptosomal fraction were also tested to determine if the significant change was also presented in total cerebellar homogenate (white). Statistical significance was determined by a two-tailed t-test. The following antibodies were employed: (A) Glutamate receptor subunit 2/3, (B) Na+/K+ ATPase alpha-1 chain, (C) alpha-tubulin, (D) cytochrome c oxidase subunit 1. Next to the immunoblot is the SILAM analysis of the same protein. The white bars represent the p1 sample, and the black bars represent the p45 sample. The Y-axis represents the 14N/15N ratio. The SILAM data were determined to be significantly altered (P < 0.05) during post-natal development by one-way ANOVA analysis followed by a Bonferroni post-hoc test to determine the significant difference of the protein expression between p1 and p45. The SILAM bar graph for alpha-tubulin represents the average mass spectrometry data for four proteins: tubulin alpha-1, tubulin alpha-2, tubulin alpha-3, and tubulin alpha-8. *P < 0.01; **P < 0.001.

References

    1. Akopians A., Runyan S.A., Phelps P.E., Runyan S.A., Phelps P.E., Phelps P.E. Expression of L1 decreases during postnatal development of rat spinal cord. J. Comp. Neurol. 2003;467:375–388. - PubMed
    1. Almeida A., Brooks K.J., Sammut I., Keelan J., Davey G.P., Clark J.B., Bates T.E., Brooks K.J., Sammut I., Keelan J., Davey G.P., Clark J.B., Bates T.E., Sammut I., Keelan J., Davey G.P., Clark J.B., Bates T.E., Keelan J., Davey G.P., Clark J.B., Bates T.E., Davey G.P., Clark J.B., Bates T.E., Clark J.B., Bates T.E., Bates T.E. Postnatal development of the complexes of the electron transport chain in synaptic mitochondria from rat brain. Dev. Neurosci. 1995;17:212–218. - PubMed
    1. Altman J., Bayer S.A., Bayer S.A. Development of the cerebellar system. CRC Press; New York: 1997.
    1. Amir R.E., Van den Veyver I.B., Wan M., Tran C.Q., Francke U., Zoghbi H.Y., Van den Veyver I.B., Wan M., Tran C.Q., Francke U., Zoghbi H.Y., Wan M., Tran C.Q., Francke U., Zoghbi H.Y., Tran C.Q., Francke U., Zoghbi H.Y., Francke U., Zoghbi H.Y., Zoghbi H.Y. Rett syndrome is caused by mutations in X-linked MECP2, encoding methyl-CpG-binding protein 2. Nat. Genet. 1999;23:185–188. - PubMed
    1. Arnold S.E., Talbot K., Hahn C.G., Talbot K., Hahn C.G., Hahn C.G. Neurodevelopment, neuroplasticity, and new genes for schizophrenia. Prog. Brain Res. 2005;147:319–345. - PubMed

Publication types

LinkOut - more resources