. 2007 Aug 14;104(33):13467-72.
doi: 10.1073/pnas.0702729104. Epub 2007 Aug 3.

Histone modifications induced by a family of bacterial toxins

Affiliations

Histone modifications induced by a family of bacterial toxins

Mélanie Anne Hamon et al. Proc Natl Acad Sci U S A. .

Erratum in

  • Proc Natl Acad Sci U S A. 2007 Oct 30;104(44):17555

Abstract

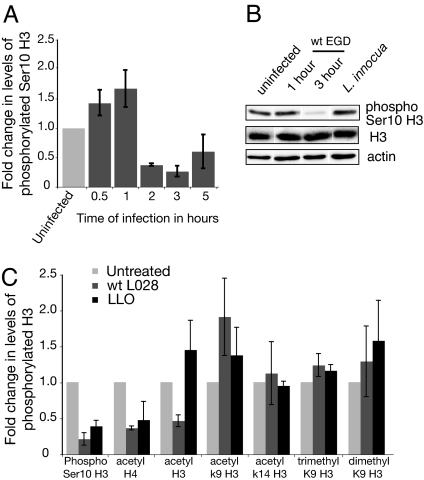
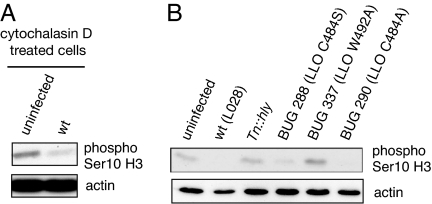
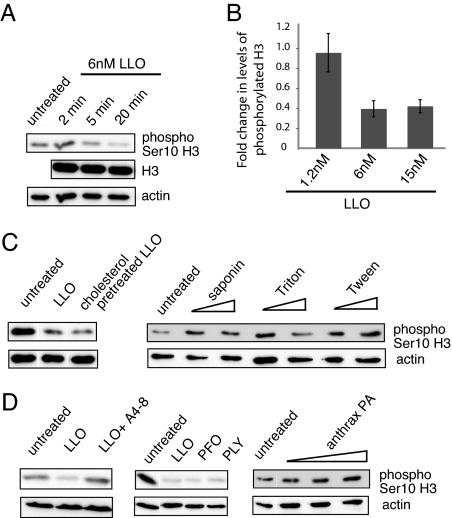
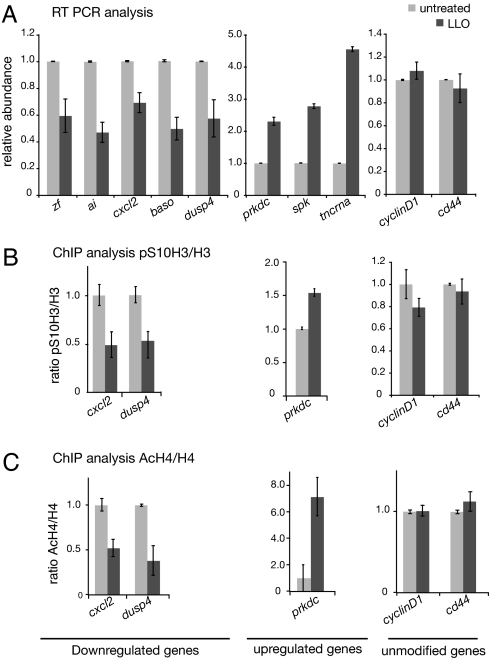
Upon infection, pathogens reprogram host gene expression. In eukaryotic cells, genetic reprogramming is induced by the concerted activation/repression of transcription factors and various histone modifications that control DNA accessibility in chromatin. We report here that the bacterial pathogen Listeria monocytogenes induces a dramatic dephosphorylation of histone H3 as well as a deacetylation of histone H4 during early phases of infection. This effect is mediated by the major listerial toxin listeriolysin O in a pore-forming-independent manner. Strikingly, a similar effect also is observed with other toxins of the same family, such as Clostridium perfringens perfringolysin and Streptococcus pneumoniae pneumolysin. The decreased levels of histone modifications correlate with a reduced transcriptional activity of a subset of host genes, including key immunity genes. Thus, control of epigenetic regulation emerges here as an unsuspected function shared by several bacterial toxins, highlighting a common strategy used by intracellular and extracellular pathogens to modulate the host response early during infection.


Conflict of interest statement

The authors declare no conflict of interest.

Figures

Fig. 1.
Fig. 1.
Histone modifications induced by L. monocytogenes. (A) Levels of phospho-Ser10 H3 as detected by Western blot were quantified and normalized, first to actin levels and then to the uninfected sample. Error bars represent SEM of at least three separate experiments. (B) Immunoblots were performed on uninfected cells and cells infected with wild L. monocytogenes and L. innocua. (C) Quantification of different histone modifications in uninfected cells, cells infected with wild-type L. monocytogenes, and cells treated with 6 nM LLO using antibodies described in Materials and Methods. Error bars show the SEM of three independent experiments.
Fig. 2.
Fig. 2.
Dephosphorylation of Ser10 H3 is induced by extracellular L. monocytogenes through LLO. (A) HeLa cells were treated with 5 μg/ml cytochalasin D for 15 min followed by infection for 3 h. (B) HeLa cells were infected with either wild-type L. monocytogenes (L028 strain), a transposon mutant of hly (BOF415) (48), or one of three hly point mutants (BUG 288, BUG 337, or BUG 290) (21) for 3 h before extraction. All results are representative of at least three independent experiments.
Fig. 3.
Fig. 3.
LLO is the listerial factor required for inducing the decrease in levels of phospho-Ser10H3. (A) Cells were incubated with 6 nM LLO for the indicated times before extraction and immunoblotting. (B) Cells were incubated with the indicated concentrations of LLO for 20 min before immunoblotting and quantification. Error bars represent the SEM of at least three separate experiments. (C) Six nanomolar LLO pretreated with 20 nM cholesterol for 30 min on ice or with 0.0006% and 0.003% saponin, Triton X-100, or Tween 20 was added to cells for 20 min. (D) Six nanomolar LLO or 6 nM LLO with 13.2 ng of A4-8 neutralizing antibody was incubated for 1 h at 37°C before adding to cells for 20 min. Cells were incubated with PFO and PLY at the same hemolytic titer as LLO for 20 min. Anthrax PA was used at 1.4, 7, and 35 nM, respectively. All results are representative of at least three independent experiments.
Fig. 4.
Fig. 4.
Changes in levels of transcription induced by LLO correlate with changes in associated modified histones. (A) Quantitative RT-PCR. The mRNA relative abundance of indicated genes is shown normalized to untreated cells and to hypoxanthine phosphoribosyltransferase (HPRT) or 18S as unmodified controls. Data are the average of at least two independent experiments. (B) Antibodies against phospho-Ser10 H3 (Abcam-12181) and H3 (Abcam-1791) were used to immunoprecipitate chromatin from formaldehyde-fixed HeLa cells untreated or treated with 6 nM LLO for 20 min. Promoter region of the indicated genes were quantified by qPCR. Data are represented as the ratio of phospho-Ser10 H3/H3 of each enrichment, relative to values obtained with unrelated IgG for each condition. Error bars represent the SEM. (C) Same experiment as in B, except immunoprecipitations were performed with anti-acH4 (Upstate 06-866), and anti-H4 (Abcam-5823).

References

    1. Hamon M, Bierne H, Cossart P. Nat Rev Microbiol. 2006;4:423–434. - PubMed
    1. Tweten RK. Infect Immun. 2005;73:6199–6209. - PMC - PubMed
    1. Villanueva MS, Sijts AJ, Pamer EG. J Immunol. 1995;155:5227–5233. - PubMed
    1. Tang P, Rosenshine I, Cossart P, Finlay BB. Infect Immun. 1996;64:2359–2361. - PMC - PubMed
    1. Repp H, Pamukci Z, Koschinski A, Domann E, Darji A, Birringer J, Brockmeier D, Chakraborty T, Dreyer F. Cell Microbiol. 2002;4:483–491. - PubMed

Publication types