. 2007 Oct;73(19):6125-33.
doi: 10.1128/AEM.00608-07. Epub 2007 Aug 3.

Agr system of Listeria monocytogenes EGD-e: role in adherence and differential expression pattern

Affiliations

Agr system of Listeria monocytogenes EGD-e: role in adherence and differential expression pattern

Aurélie Rieu et al. Appl Environ Microbiol. 2007 Oct.

Abstract

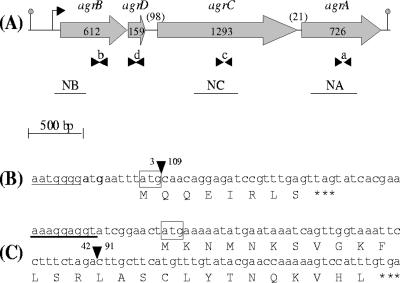
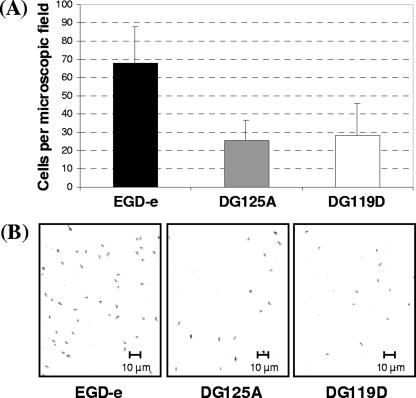
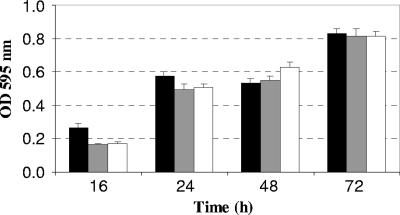
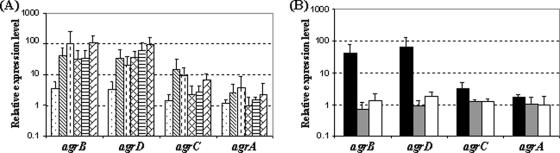
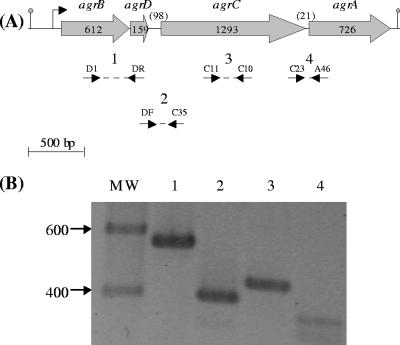
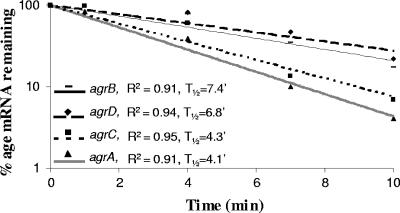
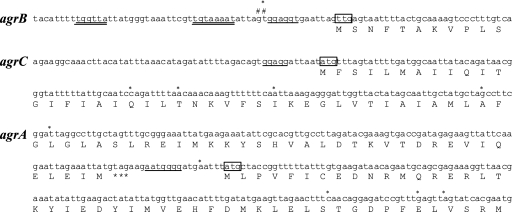
In this study, we investigated the agrBDCA operon in the pathogenic bacterium Listeria monocytogenes EGD-e. In-frame deletion of agrA and agrD resulted in an altered adherence and biofilm formation on abiotic surfaces, suggesting the involvement of the agr system of L. monocytogenes during the early stages of biofilm formation. Real-time PCR experiments indicated that the transcript levels of agrBDCA depended on the stage of biofilm development, since the levels were lower after the initial attachment period than during biofilm growth, whereas transcription during planktonic growth was not growth phase dependent. The mRNA quantification data also suggested that the agr system was autoregulated and pointed to a differential expression of the agr genes during sessile and planktonic growth. Although the reverse transcription-PCR experiments revealed that the four genes were transcribed as a single messenger, chemical half-life and 5' RACE (rapid amplification of cDNA ends) experiments indicated that the full size transcript underwent cleavage followed by degradation of the agrC and agrA transcripts, which suggests a complex regulation of agr transcription.


Figures

FIG. 1.
FIG. 1.
(A) Schematic diagram of L. monocytogenes agr operon. The gray arrows indicate the orientation and the size in base pairs of the four genes. Numbers between parentheses indicate the size in base pairs of the two intergenic regions. Arrowheads indicate the positions of the oligonucleotides used for real-time PCR: b (BR2; BF2), d (DF2; DR2), c (CF2; CR2), and a (AF2; AR2). The black lines indicate the probes used for Northern blotting (NB, NC, and NA). The position of the transcription initiation site and the transcription termination site are indicated, respectively, by the bent arrow and the gray dot. (B and C) DNA and deduced amino acid sequences of agrA gene containing a 106-bp deletion in DG125A (ΔagrA) mutant (B) and of agrD gene containing a 49-bp deletion in DG119D (ΔagrD) mutant (C). The position of the deletion is represented by an inverted black triangle, the nucleotides before and after the deletion are mentioned, the ribosome binding sites are underlined, the start codons are boxed, and the stop codon is represented by three asterisks.
FIG. 2.
FIG. 2.
(A) L. monocytogenes EGD-e (▪), DG125A (ΔagrA) (□), and DG119D (ΔagrD) (□) cell adhesion after 2 h of incubation at 25°C on glass slides. Histograms represent the number of adhered cells counted per microscopic field. Each bar indicates the mean of three independent experiments with four microscopic fields per experiment. (B) Micrographs of microscopic fields showing L. monocytogenes EGD-e, DG125A (ΔagrA), and DG119D (ΔagrD) cells adhering to glass slides after 2 h of incubation at 25°C. Magnification, ×63.
FIG. 3.
FIG. 3.
Biofilm formation by L. monocytogenes EGD-e (▪), DG125A (ΔagrA) (□), and DG119D (ΔagrD) (□) in batch conditions in polystyrene 96-well plates after 16, 24, 48, and 72 h of incubation at 25°C. Each histogram indicates the mean of three independent experiments, with five measurements for each point.
FIG. 4.
FIG. 4.
Semilogarithmic representations. (A) Relative expression levels of the agrB, agrD, agrC, and agrA genes of the parental strain L. monocytogenes EGD-e determined during biofilm formation (2, 24, and 72 h [the first three columns in each gene, respectively] and planktonic growth (early exponential phase OD600 of 0.1, mid-exponential phase OD600 of 0.4, and stationary phase OD600 of 0.6 [the second three columns for each gene, respectively]). (B) Relative expression levels of the agrB, agrD, agrC, and agrA genes of L. monocytogenes determined during mid-exponential phase OD600 of 0.4: EGD-e strain (▪), DG125A (ΔagrA) strain (□), and DG119D (ΔagrD) strain (□). For both graphs, gene expression was quantified by using real-time PCR and the comparative critical threshold (ΔΔCT) method. The drm gene was used as the internal standard, and expression of the agrA gene in the early exponential phase (OD600 of 0.1) was used as the calibrator. Three independent experiments were performed; histograms indicate standard deviations.
FIG. 5.
FIG. 5.
RT-PCR analysis of RNA from L. monocytogenes cells at mid-exponential phase (OD600 of 0.4). (A) The dotted lines enclosed by arrows indicate the positions of the primers and PCR products. (B) The amplified products, lane numbers 1 to 4, were separated by electrophoresis on 1% agarose gel and correspond, respectively, to the expected sizes of 567, 388, 435, and 353 bp. The sizes of the DNA marker fragments are indicated in base pairs.
FIG. 6.
FIG. 6.
Chemical half-life of the transcripts of the agr operon. Semilogarithmic plots of mRNA decay corresponding to the agrB (-), agrD (⧫), agrC (▪), and agrA (▴) genes. Total RNA was prepared 0, 1, 4, 7, and 10 min after treatment with rifampin (250 μg ml−1). The results were obtained by real-time PCR analysis and normalized using 16S mRNA amounts. The correlation coefficient (R2) and half-life (t1/2) were determined for each regression analysis. Three independent experiments were carried out.
FIG. 7.
FIG. 7.
Analysis of the 5′ end of agrB, agrC, and agrA transcripts using total RNAs isolated from EGD-e cells collected during the exponential growth phase (OD600 of 0.4). #, 5′ end identified by primer extension; *, processing sites identified by 5′-RACE. The putative −10 with TGn extension and −35 sequences are double underlined, the ribosome binding sites are underlined, the start codons are boxed, and the stop codon of agrC is represented by three asterisks.

Similar articles

Cited by

References

    1. Aguado, V., A. I. Vitas, and I. Garcia-Jalon. 2004. Characterization of Listeria monocytogenes and Listeria innocua from a vegetable processing plant by RAPD and REA. Int. J. Food Microbiol. 90:341-347. - PubMed
    1. Allenby, N. E. E., N. O'Connor, Z. Pragai, N. M. Carter, M. Miethke, S. Engelmann, M. Hecker, A. Wipat, A. C. Ward, and C. R. Harwood. 2004. Post-transcriptional regulation of the Bacillus subtilis pst operon encoding a phosphate-specific ABC transporter. Microbiology 150:2619-2628. - PubMed
    1. Allison, D. G., B. Ruiz, C. San Jose, A. Jaspe, and P. Gilbert. 1998. Extracellular products as mediators of the formation and detachment of Pseudomonas fluorescens biofilms. FEMS Microbiol. Lett. 167:179-184. - PubMed
    1. Arvidson, S., and K. Tegmark. 2001. Regulation of virulence determinants in Staphylococcus aureus. Int. J. Med. Microbiol. 291:159-170. - PubMed
    1. Auger, S., E. Krin, S. Aymerich, and M. Gohar. 2006. Autoinducer 2 affects biofilm formation by Bacillus cereus. Appl. Environ. Microbiol. 72:937-941. - PMC - PubMed

Publication types

MeSH terms